Silver Price Analysis: XAG/USD bears take a breather around $23.00 as 100-SMA probes further declines
- Silver prices struggle to overcome intraday low, reverses Monday’s gains.
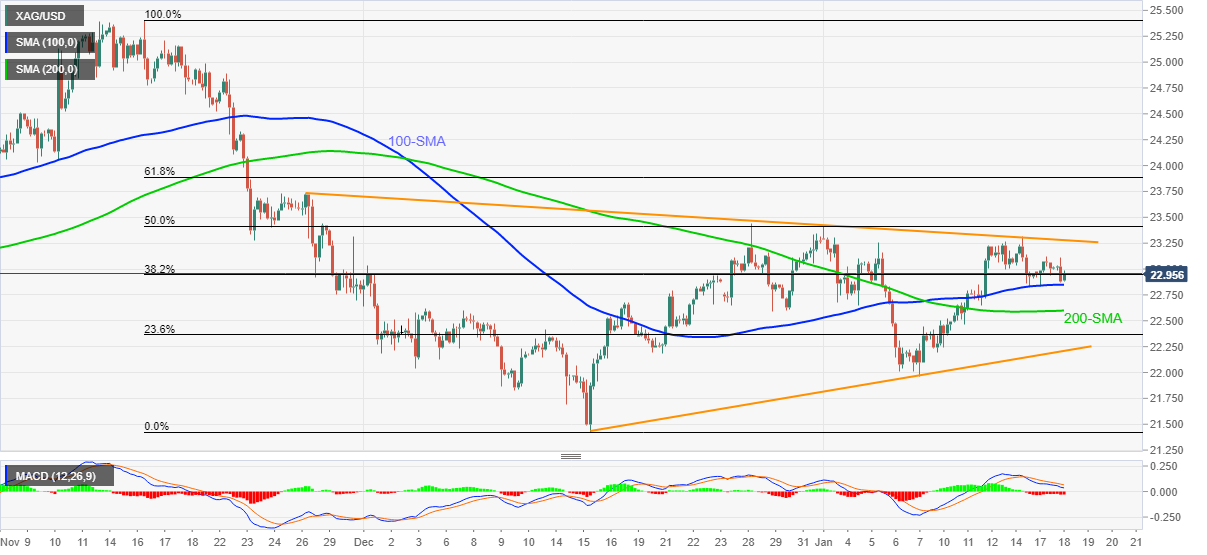
- Bearish MACD signals keep sellers hopeful inside short-term symmetrical triangle.
- 200-SMA, 50% Fibonacci retracement act as additional trading filters.

Silver (XAG/USD) fades bounce off intraday low, down 0.40% on a day while recently easing to $22.92 ahead of Tuesday’s European session.
In doing so, the bright metal drops back to the 100-SMA while staying inside a two-month-old symmetrical triangle.
Given the bearish MACD signals and repeated failures to stay firmer above the 100-SMA, XAG/USD is likely to break the $22.85 immediate support.
Following that, the 200-SMA level of $22.60 may offer an intermediate halt during the metal’s likely fall towards the stated triangle’s support line near $22.20.
On the contrary, a clear upside break of the triangle’s resistance line, close to $23.30, becomes necessary for the commodity prices to aim for a 50% Fibonacci retracement level of November-December downside, near $23.40.
In a case where silver rises past $23.40, the late November swing high near $23.75 may test the bulls before directing them to the $24.00 threshold.
Overall, silver prices are likely to remain pressured inside a neutral chart pattern.
Silver: Four-hour chart
Trend: Further weakness expected
Author

Anil Panchal
FXStreet
Anil Panchal has nearly 15 years of experience in tracking financial markets. With a keen interest in macroeconomics, Anil aptly tracks global news/updates and stays well-informed about the global financial moves and their implications.