|

Silver Price Analysis: Making lower lows in the short-term

  • Silver is declining steadily on the intraday charts suggesting a short-term bear trend bias at work. 
  • The precious metal is currently pulling back up to resistance from the bottom of a mini-range. 
  • It will probably roll-over and begin descending again as the pattern of lower lows continues. 

Silver (XAG/USD) is in a step decline on the four-hour chart after piercing below the bottom of a mini-range it formed after peaking in mid-May. 

The precious metal fell to a new low at $29.12, at the level of the 200 Simple Moving Average (SMA) following the release of market-moving data on Friday.  

Silver 4-hour Chart 

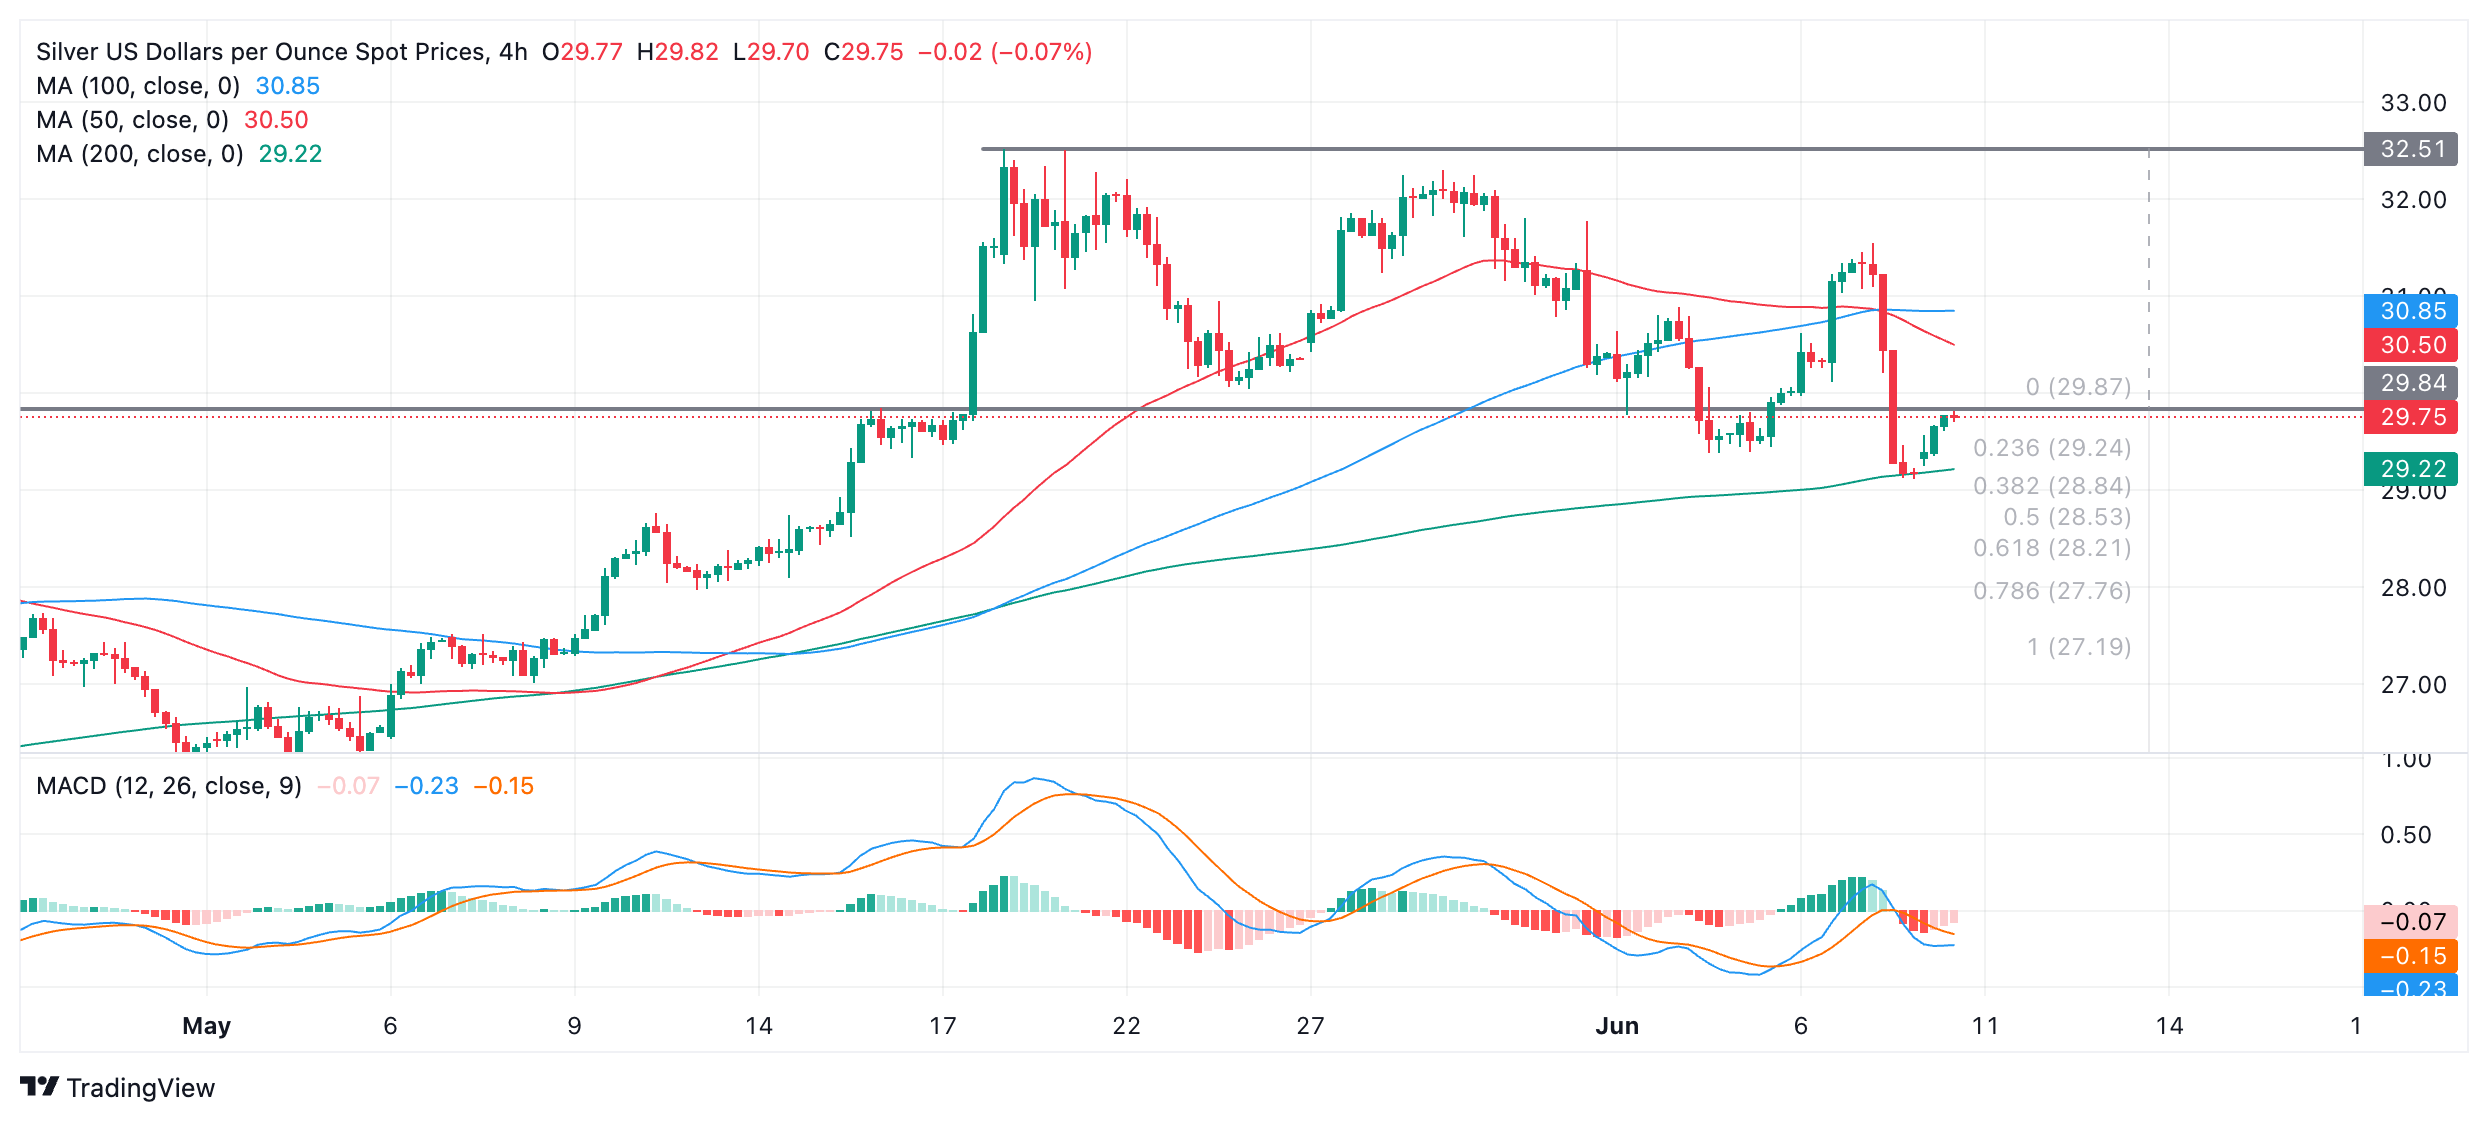
It has since pulled back up to resistance from the floor of the range. On balance Silver looks bearish in the short-term and the price will probably roll-over and continue down. 

A break below $29.12 (June 7 low) would confirm a lower low and probably a move down to an initial target at $28.21. This is the 0.618 Fibonacci ratio of the height of the range extrapolated lower, the normal method for establishing targets after breakouts from ranges. Further bearishness could see Silver even reach as low as $27.19, the 100% extrapolation of the height of the range lower. 

Alternatively a move above the $31.55 lower high would bring the bearish short-term bias into doubt and suggest the possibility of a recovery back up to the range high at $32.51.

Author

Joaquin Monfort

Joaquin Monfort is a financial writer and analyst with over 10 years experience writing about financial markets and alt data. He holds a degree in Anthropology from London University and a Diploma in Technical analysis.

More from Joaquin Monfort
Share:

Editor's Picks

AUD/USD eyes 0.7150 barrier nine-day EMA

AUD/USD inches higher after registering modest losses in the previous day, trading around 0.7130 during the Asian hours. The technical analysis of the daily chart indicates that the pair is moving sideways within the rectangle pattern, suggesting a consolidation as neither the bulls nor the bears have enough momentum to take control of the market.

USD/JPY trades below 160.00 intervention threshold; bullish bias intact

The USD/JPY pair attracts some sellers during the Asian session amid fears that authorities will step in again to prop up the Japanese Yen. Furthermore, the Israel-Lebanon truce prompts some profit-taking around the US Dollar and exerts downward pressure on the currency pair.

Gold puts its 200-day SMA to the test near $4,420

Gold keeps the bullish stance in place in the latter part of Thursday’s session, although a convincing break above the key $4,500 mark per troy ounce still remains elusive. The precious metal’s advance comes amid the resurgence of some selling interest around the Greenback, improving risk sentiment, and declining US Treasury yields across the board.

Bitcoin’s massive storm is back: Why the sell-off is far from over

Bitcoin price action over the last few weeks has felt less like a normal, healthy correction and more like a slow grinding crash that continues to wreak havoc on holdings and trading accounts. And everything suggests that the dramatic crash isn’t over.

Nonfarm payrolls: Testing the limits of Fed policy patience

The upcoming nonfarm payrolls report for May will provide the final update on the US labor market before Kevin Warsh attends his first policy meeting as the new Fed Chair later this month.

Recession on paper: What really moves the Canadian Loonie now?

Statistics Canada handed the headline writers a gift and the analysts a headache. Real GDP shrank 0.1% on an annualized basis in the first quarter, and with the fourth quarter of 2025 revised down to a 1.0% contraction, that is two negative quarters in a row, the textbook definition of a technical recession and Canada's first since the pandemic.