|

Silver Price Analysis: Bulls testing bear's commitments at daily resistance

  • Silver remains positively correlated to the stock market.
  • Bulls are seeking a break of the daily resistance if the S&P 500 can penetrate resistance. 

As per the prior analysis, 'Silver is stalling on the offer, but intermarket correlations are compelling' the price of silver continues to depend on the stock market.

Wall Street has rebounded following a two-day fall which has weighed on the greenback on Wednesday and lifted the price of the white metal. 

S&P 500 / XAG/USD 4-hour chart

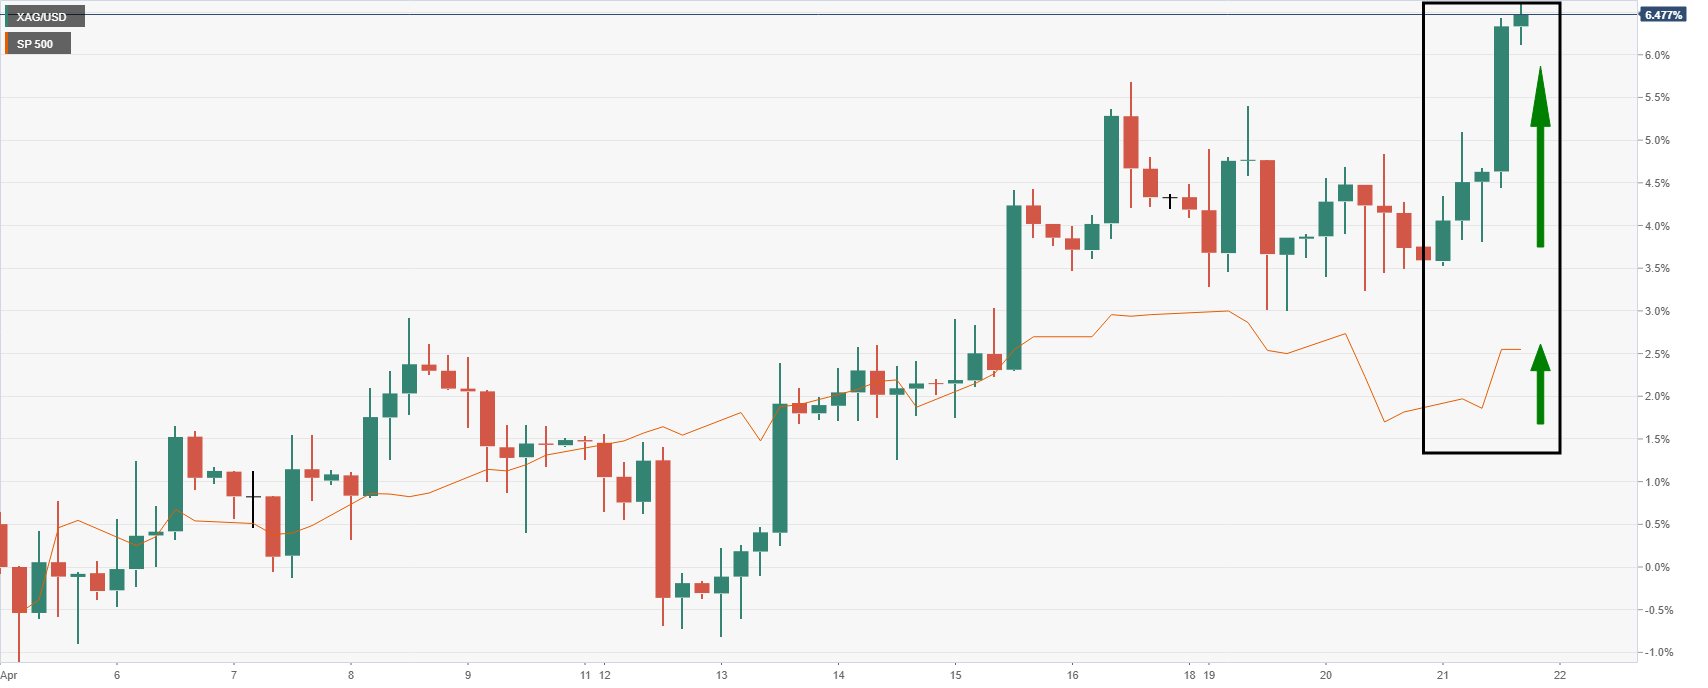
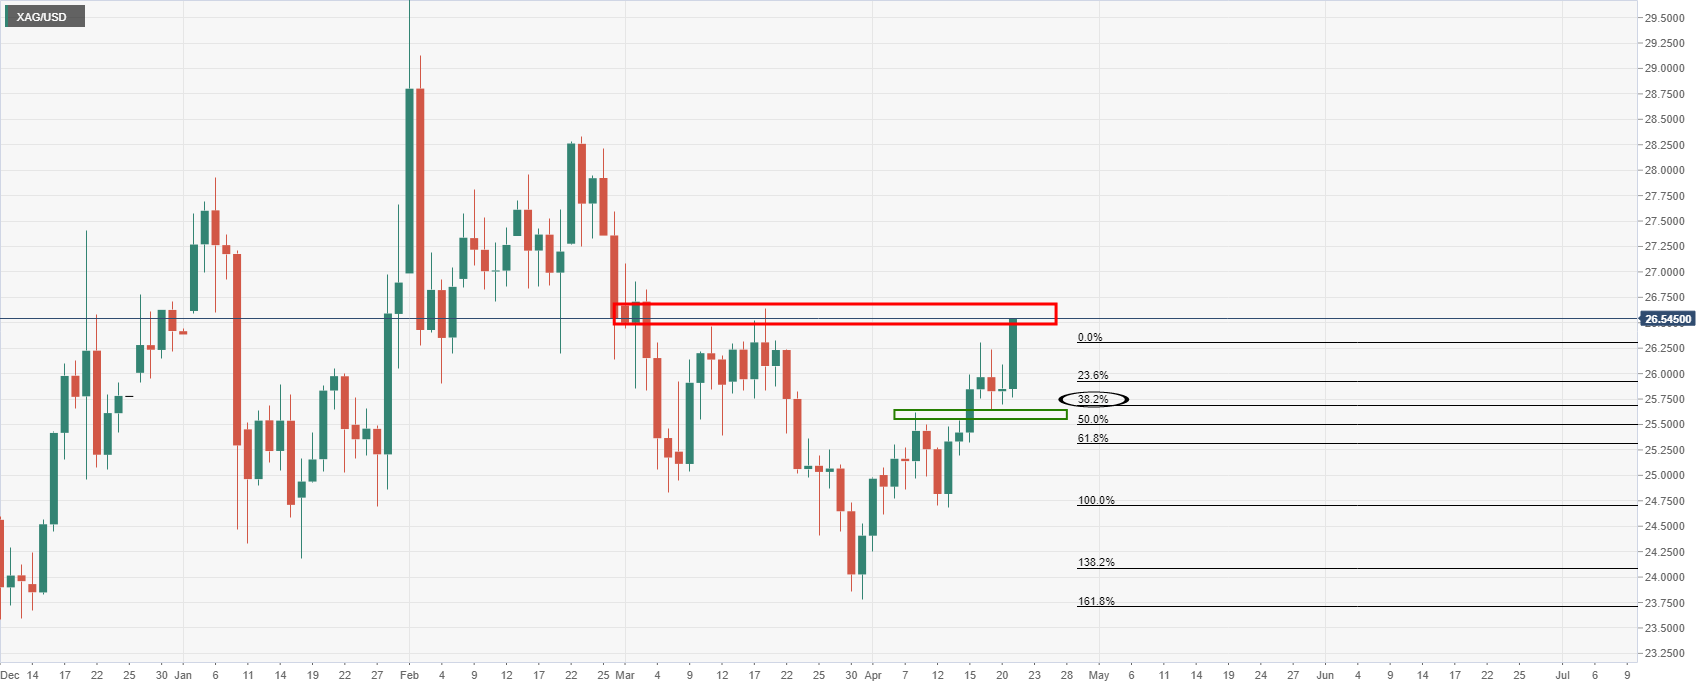
Meanwhile, this has translated into a fresh daily bullish impulse following a correction to the 38.2% Fibonacci retracement area and monthly support:

Monthly chart

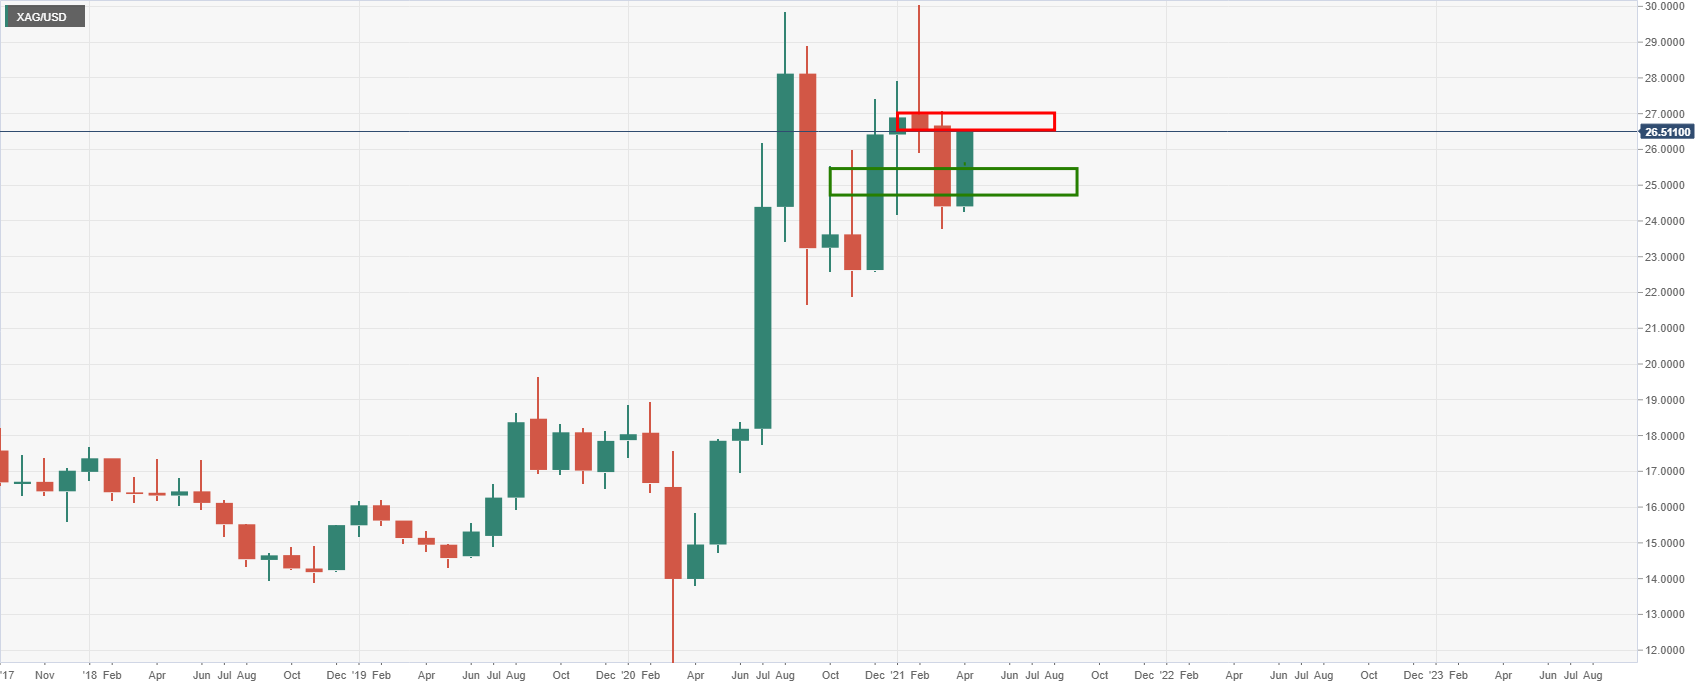
A break of monthly resistance is now the focus. 

Moving down to the daily chart, however, is where the action will be for the near term noting the daily resistance. 

Daily resistance

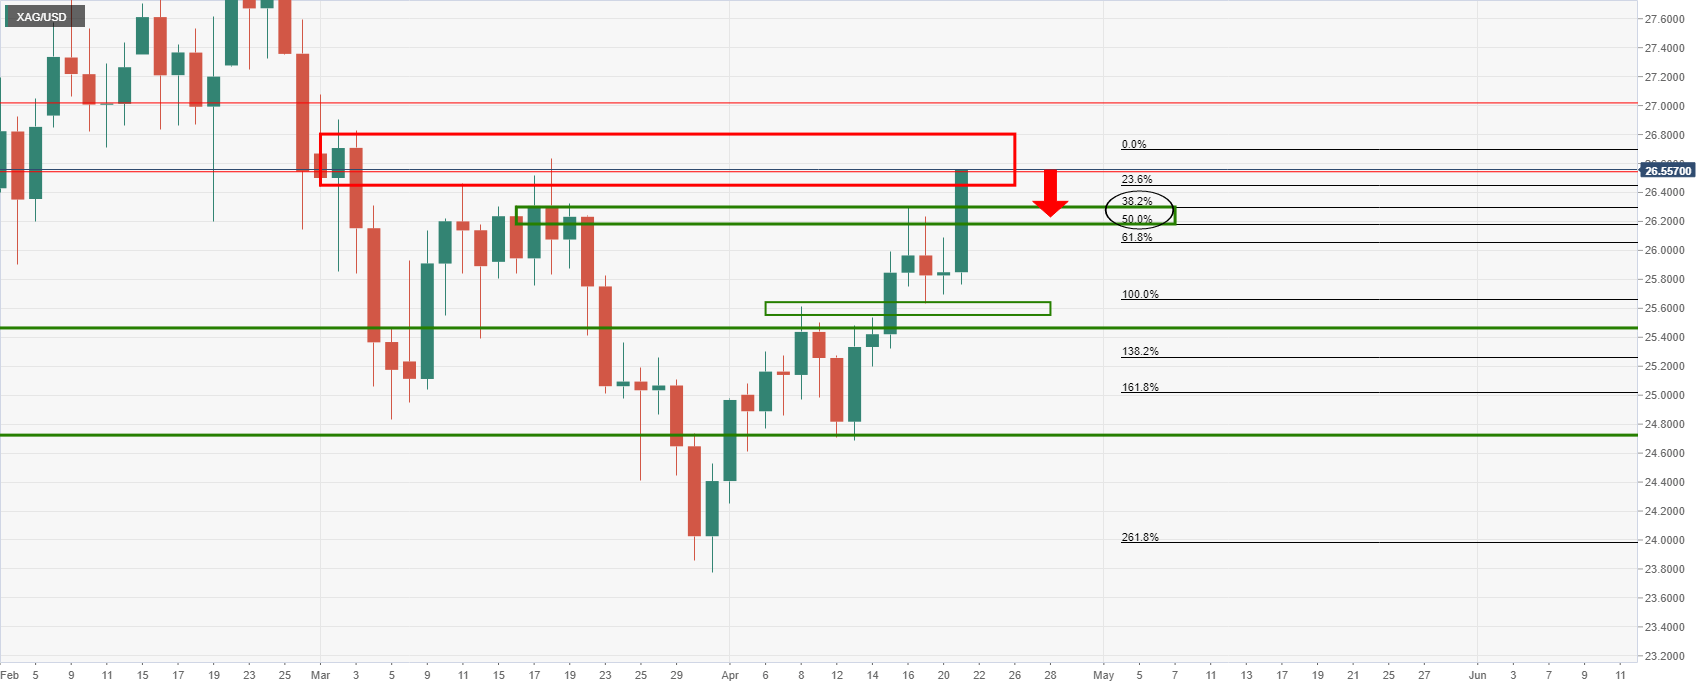
The price is meeting a daily resistance zone and while there is room for a deeper test of the bear's commitments, the path of least resistance is likely to the downside.

There is the case for a restest of the prior resistance now expected to turn support. 

However, again, the correlation with the stock market is compelling and should the S^P 500 continue to recover and move higher, then silver will likely clear the daily resistance.

This will set the stage for a test of the moth resistance for a fresh bullish impulse towards higher highs.

S&P 500 daily chart

Author

Ross J Burland

Ross J Burland, born in England, UK, is a sportsman at heart. He played Rugby and Judo for his county, Kent and the South East of England Rugby team.

More from Ross J Burland
Share:

Editor's Picks

EUR/USD weakens as US jobs data trims Fed rate cut bets

The EUR/USD pair trades in negative territory for the third consecutive day near 1.1860 during the early European session on Thursday. Traders will keep an eye on the US weekly Initial Jobless Claims data. On Friday, the attention will shift to the US Consumer Price Index inflation report. 

GBP/USD bullish outlook prevails above 1.3600, UK GDP data looms

The GBP/USD pair gains ground near 1.3635, snapping the two-day losing streak during the early European session on Thursday. The preliminary reading of UK Gross Domestic Product for the fourth quarter will be closely watched later on Thursday. The UK economy is estimated to grow 0.2% QoQ in Q4, versus 0.1% in Q1. 

Gold remains on the defensive below two-week top; lacks bearish conviction amid mixed cues

Gold sticks to modest intraday losses through the Asian session on Thursday, though it lacks follow-through selling and remains close to a nearly two-week high, touched the previous day. The commodity currently trades above the $5,070 level, down just over 0.20% for the day, amid mixed cues.

UK GDP set to post weak growth as markets rise bets on March rate cut

Markets will be watching closely on Thursday, when the United Kingdom’s Office for National Statistics will release the advance estimate of Q4 Gross Domestic Product. If the data land in line with consensus, the UK economy would have continued to grow at an annualised pace of 1.2%, compared with 1.3% recorded the previous year. 

The market trades the path not the past

The payroll number did not just beat. It reset the tone. 130,000 vs. 65,000 expected, with a 35,000 whisper. 79 of 80 economists leaning the wrong way. Unemployment and underemployment are edging lower. For all the statistical fog around birth-death adjustments and seasonal quirks, the core message was unmistakable. The labour market is not cracking.

Sonic Labs’ vertical integration fuels recovery in S token

Sonic, previously Fantom (FTM), is extending its recovery trade at $0.048 at the time of writing, after rebounding by over 12% the previous day. The recovery thesis’ strengths lie in the optimism surrounding Sonic Labs’ Wednesday announcement to shift to a vertically integrated model, aimed at boosting S token utility.