Shopify Stock News and Forecast: SHOP likely to break below $600
- SHOP broke support at $703 on February 17.
- Shopify stock should remain under pressure as NASDAQ 100 futures sink 2.5% on Tuesday.
- Support for the ecommerce company shares is now at $594.

Shopify (SHOP) has surprised investors with how far it has fallen. The market correction that began in November 2021 has led SHOP stock to drop 63% from its all-time high. With the further drop on Thursday, February 17, SHOP broke through the significant $703 level. Now the only measure of support comes at $594, which is why the ecommerce titan will likely break through $600 soon enough. SHOP shares closed at $656.88 on Friday.
Shopify Stock News: Capex, Russia weigh on sentiment
First things first, Russia has both recognized the breakaway regions of Ukraine and sent some number of troops into those territories. This intensifies relations with European countries and the US, who see the moves as a means of weakening Ukraine and possibly giving Russia an excuse for invading Kiev. This news has ignited more fear that a full on invasion is nigh, and markets are not taking this news in stride. The NASDAQ 100 futures are down 2.5% on Tuesday morning. This means many of the risk-on growth stocks out there, such as Shopify, are more than likely to sell off. Brent oil is nearing $100.
Less immediately, the twin obstacles of higher interest rates and increasing capex has concerned SHOP shareholders. Though Shopify is the only major competitor to Amazon's ecommerce empire, management's decision to invest heavily in fulfillment (actual brick-and-mortar warehouses) has the markets worried about putting off earnings. Until now, Shopify has broadly been a software company with sky-high margins. As it breaks into the physical aspect of ecommerce, many observers expect those margins to fall drastically.
One reason the market desires a focus on earnings now is that the Federal Reserve is expected to raise interest rates several times this year to combat inflation. Not only would this have the side effect of slowing economic growth, but it would also increase the attractiveness of bonds relative to equities, raise borrowing costs for those equities and reduce the value of future company earnings.
Then there is analyst consensus. With Wall Street unsure where things are headed, analysts revised earnings per share (EPS) estimates lower 21 times in the past 90 days. Consensus is now adjusted EPS of $0.84 compared with $1.36 in Q4. Revenue is estimated at $1.25 billion compared with $1.38 billion in the fourth quarter.
SHOP key statistics
| Market Cap | $75 billion |
| Price/Earnings | 26 |
| Price/Sales | 16 |
| Price/Book | 7 |
| Enterprise Value | $68 billion |
| Operating Margin | 8% |
| Profit Margin |
63% |
| 52-week high | $1,762.92 |
| 52-week low | $640.42 |
| Short Interest | 4% |
| Average Wall Street Rating and Price Target | Buy, $1,778.90 |
Shopify Stock Forecast: Wait to enter at $594
SHOP shares dropped below the $703 support level on February 17. That support came from May and June 2020. Now that it is broken, $594 is the only level to keep one's eyes on. This price comes from the February 12, 2020, high of $593.89 and the May 1, 2020, low of $595.03. If SHOP keeps dropping, then $470 is the next refuge.
Although SHOP is an attractive investment for the long-term investor, there is no reason to think it will reverse to the $1,700s anytime soon. First, it needs to reconquer $800, which has served as support in the past few weeks. Then it needs to retake $932.54 – the range high from earlier this month. Either of these seem unlikely in the current environment. When stocks sell off this much, it typically means that some long-term or institutional investors are unloading, and it can take a season or two until most shares are once again held by investors with long-term horizons.
The Relative Strength Index (RSI) is now at 29, but it has been here before at much higher prices. The Moving Average Convergence Divergence (MACD) has also crossed lower once again, which typically signals that the stock has not bottomed out yet.
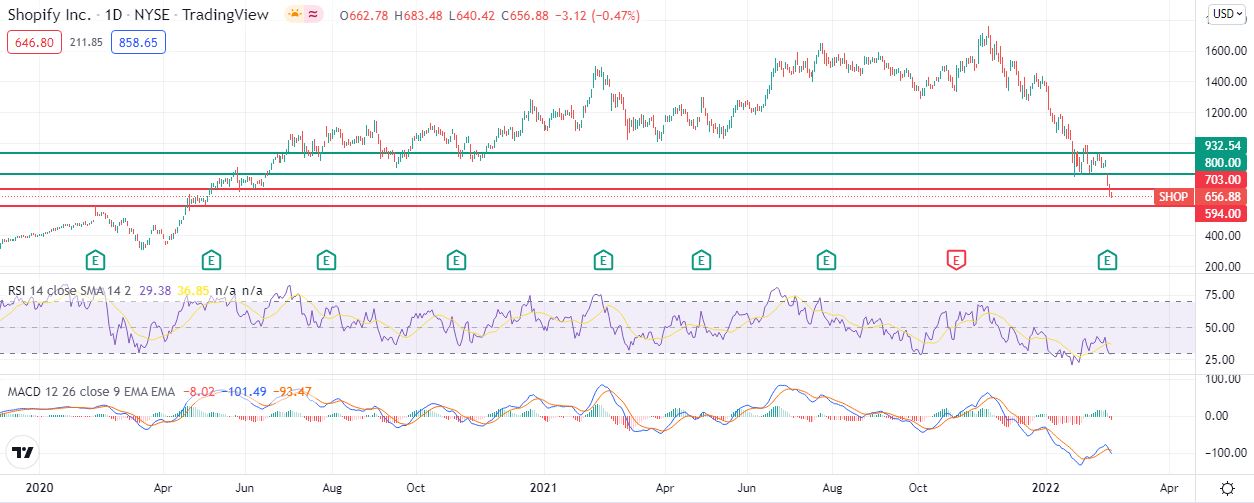
SHOP 1-day chart
Like this article? Help us with some feedback by answering this survey:
Author

Clay Webster
FXStreet
Clay Webster grew up in the US outside Buffalo, New York and Lancaster, Pennsylvania. He began investing after college following the 2008 financial crisis.


