Shanghai Composite Index Elliott Wave technical analysis [Video]
![Shanghai Composite Index Elliott Wave technical analysis [Video]](https://editorial.fxsstatic.com/images/i/flag-china-02.jpg)
Shanghai Composite Elliott Wave technical overview
Function: Bullish Trend.
Mode: Impulsive.
Structure: Gray Wave 3.
Position: Orange Wave 3.
Direction (Higher degrees): Gray Wave 3 (Started).
Details: Gray Wave 2 appears complete; Gray Wave 3 is now active.
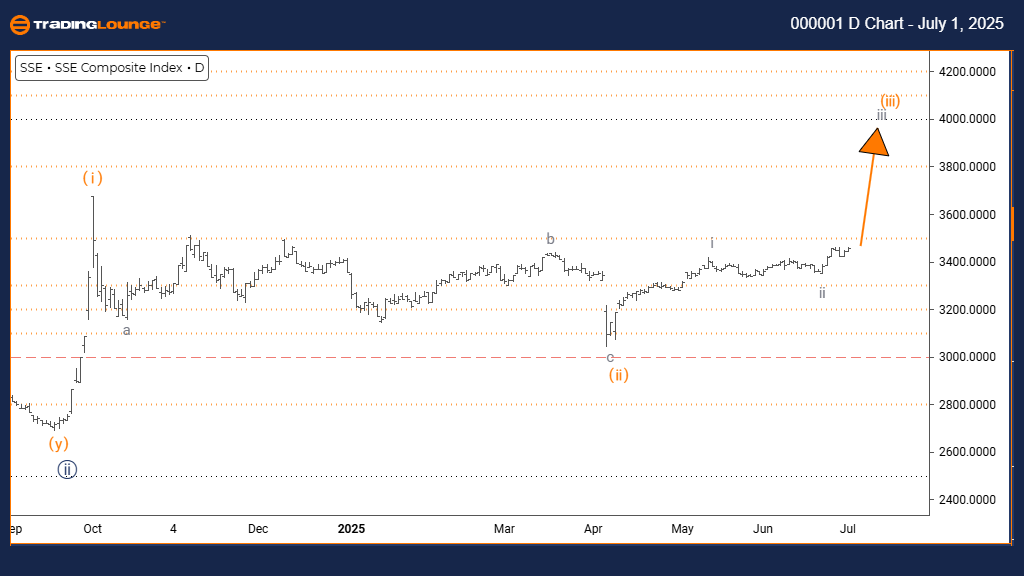
Daily chart summary
The daily chart analysis of the Shanghai Composite shows a bullish trend in progress. Price action is in impulsive mode, suggesting strong upward momentum. The current structure is Gray Wave 3, which is part of the larger Orange Wave 3 sequence. This setup points to a powerful advancing phase in the overall bullish cycle.
Wave 2 to 3 transition
Gray Wave 2 seems to have finished its corrective phase, marking the beginning of Gray Wave 3. This wave usually carries the most significant price movement in Elliott Wave theory and often reflects heightened market optimism and volume.
Technical outlook
With Gray Wave 3 now developing, following the end of Wave 2, the Shanghai Composite appears poised for further gains. The impulsive nature of this wave implies strong buying pressure and the potential for a continued rally in the short to mid-term.
Shanghai Composite Elliott Wave technical overview
Function: Bullish Trend.
Mode: Impulsive.
Structure: Orange Wave 3.
Position: Navy Blue Wave 3.
Direction (Lower degrees): Orange Wave 4.
Details: Orange Wave 2 appears complete; Orange Wave 3 is now underway.
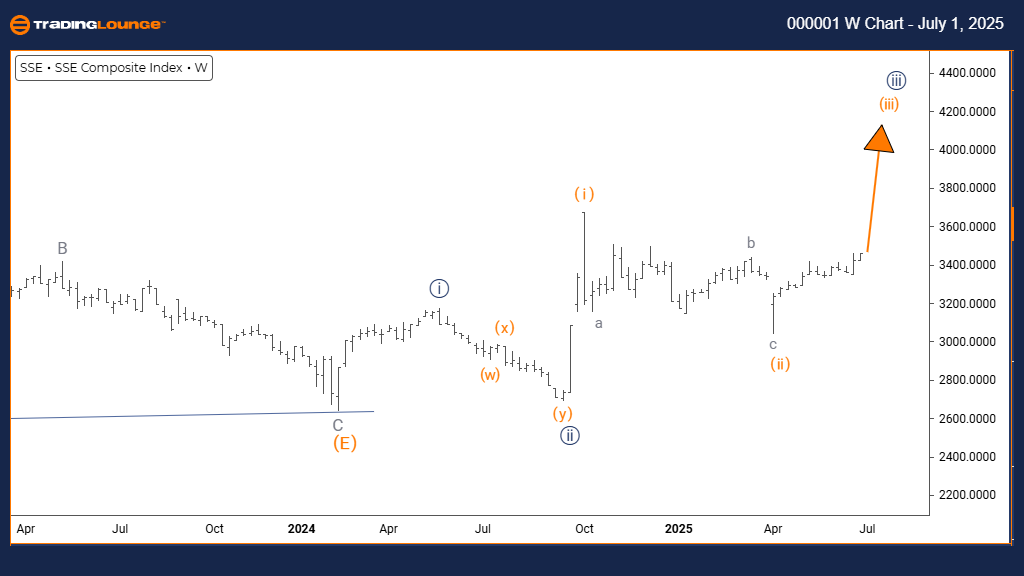
Weekly chart summary
The weekly Elliott Wave analysis for the Shanghai Composite confirms a bullish outlook. The price is in impulsive mode, showing sustained upward movement. Orange Wave 3 is the current wave being tracked, forming part of the broader Navy Blue Wave 3. This is often the most dynamic phase in a bullish cycle, where price rallies are strong and prolonged.
Wave 2 to 3 shift
With the completion of Orange Wave 2, the index has transitioned into Orange Wave 3. This phase typically sees sharp upward movement with minimal retracement. The next wave to watch at a lower degree is Orange Wave 4, expected after Orange Wave 3 concludes.
Technical outlook
The technical chart suggests that the Shanghai Composite is in a robust uptrend. With Orange Wave 3 now active and strong momentum behind the move, traders should monitor for continued bullish price action. A break below the invalidation point would require a reassessment of the wave count, but until then, the trend remains supported.
Shanghai Composite Elliott Wave technical overview [Video]
Author

Peter Mathers
TradingLounge
Peter Mathers started actively trading in 1982. He began his career at Hoei and Shoin, a Japanese futures trading company.


