Shanghai Composite Index Elliott Wave technical analysis [Video]
![Shanghai Composite Index Elliott Wave technical analysis [Video]](https://editorial.fxsstatic.com/images/i/General-Stocks_1.png)
Shanghai Composite Elliott Wave technical analysis
-
Function: Bullish Trend.
-
Mode: Impulsive.
-
Structure: Orange Wave 3.
-
Position: Navy Blue Wave 3.
-
Direction next higher degrees: Orange Wave 3 (Started).
Details:
-
Orange Wave 2 appears to be completed, with Orange Wave 3 now in play.
-
Wave cancel invalidation level: 2684.5610
The Shanghai Composite daily chart analysis applies Elliott Wave Theory, indicating a bullish trend with an impulsive structure. The primary focus is on Orange Wave 3, which has commenced following the completion of Orange Wave 2. This suggests continued upward momentum within the ongoing bullish cycle.
Currently, the price is positioned in Navy Blue Wave 3, marking the middle phase of the bullish sequence. The completion of Orange Wave 2 has set the stage for Orange Wave 3, which typically represents a strong upward move, often accompanied by higher market activity.
The analysis highlights that Orange Wave 3 has started, indicating that price movements will likely continue upward throughout this phase. Orange Wave 3 is generally characterized by dynamic price action, reflecting strong bullish sentiment among investors.
The wave cancel invalidation level is set at 2684.5610. A drop below this level would invalidate the current wave count, requiring a reevaluation of the market structure.
Summary
The Shanghai Composite daily chart analysis suggests a strong bullish phase, with Orange Wave 3 actively progressing within Navy Blue Wave 3. The completion of Orange Wave 2 marks the beginning of a potentially significant upward trend.
Traders and investors should closely monitor price movements and use the invalidation level as a reference for validating or adjusting market strategies. This analysis provides essential insights into the ongoing bullish trend and expected market dynamics.
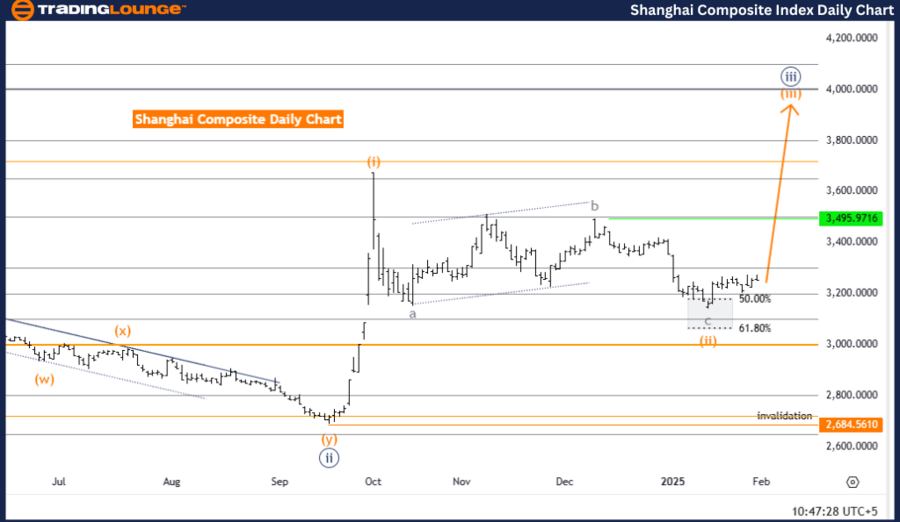
Daily chart
Shanghai Composite Elliott Wave technical analysis
-
Function: Bullish Trend.
-
Mode: Impulsive.
-
Structure: Orange Wave 3.
-
Position: Navy Blue Wave 3.
-
Direction next higher degrees: Orange Wave 3 (Started).
Details:
-
Orange Wave 2 appears to be completed, with Orange Wave 3 now in play.
-
Wave cancel invalidation level: 2684.5610.
The Shanghai Composite weekly chart analysis applies Elliott Wave Theory, confirming a bullish trend in an impulsive wave structure. The market focus is on Orange Wave 3, which has commenced following the completion of Orange Wave 2. This development suggests a continuation of upward momentum within the current bullish cycle.
Currently, the market is positioned in Navy Blue Wave 3, representing a critical phase within the broader impulsive wave structure. This positioning implies sustained bullish momentum as the market advances through this Elliott Wave formation. The initiation of Orange Wave 3 after the completion of Orange Wave 2 typically signals a strong upward trend, often accompanied by higher trading volume and price acceleration.
The analysis highlights that Orange Wave 3 is actively developing, indicating further market gains as this impulsive wave unfolds. The completion of the previous corrective phase has set the stage for bullish market dynamics, reinforcing expectations for continued upward movement. Traders and investors should monitor price action closely during this phase.
The wave cancel invalidation level is set at 2684.5610. A price drop below this level would invalidate the current wave count, necessitating a reassessment of the market structure.
Summary
The Shanghai Composite weekly chart analysis reveals a bullish trend, with Orange Wave 3 progressing within Navy Blue Wave 3. The completion of Orange Wave 2 supports expectations for further upside movement.
Investors should closely track price developments and use the invalidation level as a reference for confirming or adjusting trading strategies. This analysis provides valuable insights into market dynamics and the ongoing bullish trajectory.
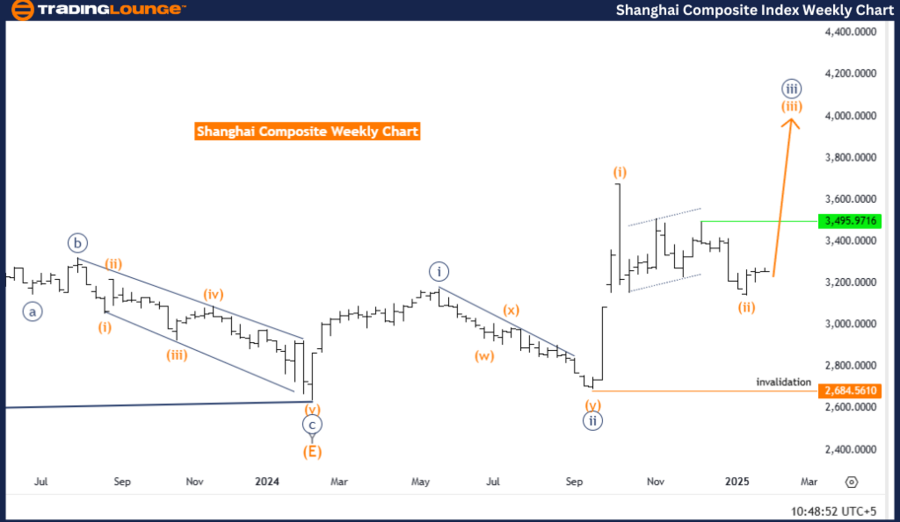
Weekly chart
Shanghai Composite Index Elliott Wave technical analysis [Video]
Author

Peter Mathers
TradingLounge
Peter Mathers started actively trading in 1982. He began his career at Hoei and Shoin, a Japanese futures trading company.


