Shanghai Composite Elliott Wave technical analysis [Video]
![Shanghai Composite Elliott Wave technical analysis [Video]](https://editorial.fxstreet.com/images/i/bearish-line_XtraLarge.png)
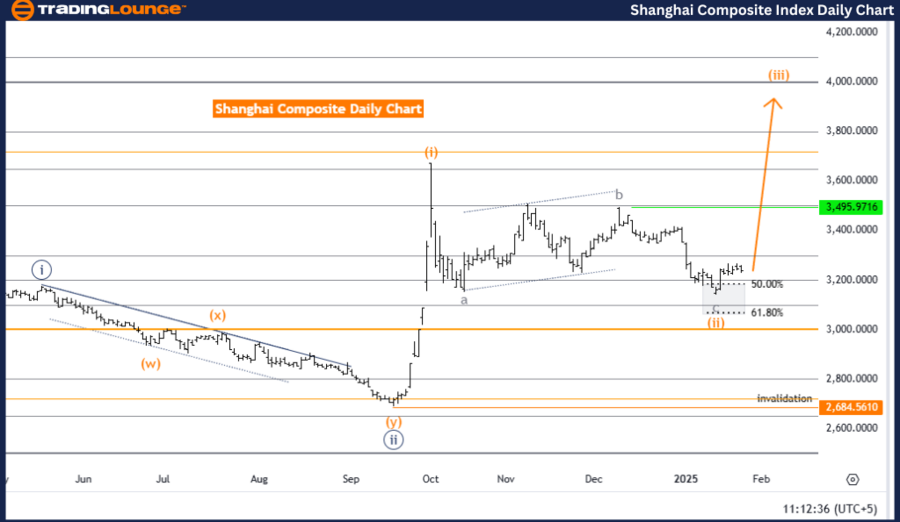
Shanghai Composite Elliott Wave Analysis Trading Lounge day chart
Shanghai Composite Elliott Wave technical analysis
Technical analysis overview
-
Function: Bullish Trend.
-
Mode: Impulsive.
-
Structure: Orange Wave 3.
-
Position: Navy Blue Wave 3.
-
Direction next higher degrees: Orange Wave 3 (Started).
-
Details: Orange wave 2 appears completed, and orange wave 3 is now in progress.
-
Wave cancel invalid level: 2684.5610.
Analysis overview
The Shanghai Composite daily chart analysis confirms a bullish trend, based on Elliott Wave principles. The market's current mode is classified as impulsive, indicating strong upward momentum. The ongoing wave structure, identified as orange wave 3, represents a key phase within the larger bullish trend, signaling continued price growth.
The position within the wave sequence is noted as navy blue wave 3, which suggests the ongoing progression of the broader bullish movement. This phase plays a critical role in driving the upward trajectory of the market. The development of orange wave 3 within this framework highlights the market's sustained strength.
The completion of orange wave 2 marks the transition into the next phase, orange wave 3, setting the foundation for further potential gains. The direction in the next higher degrees continues to support the market's upward trajectory, reinforcing the potential for sustained bullish momentum.
Key invalidation level
An invalidation level has been set at 2684.5610, acting as a crucial reference point. If the price falls below this level, the current wave count will be invalidated, prompting a reassessment of the analysis. As long as the price remains above this level, the bullish outlook stays valid and intact.
Conclusion
In summary, the Shanghai Composite daily chart demonstrates a strong bullish trend, driven by the development of orange wave 3 within the larger navy blue wave 3. The completion of orange wave 2 has established the groundwork for the current upward movement. With the invalidation level positioned at 2684.5610, the bullish perspective remains valid, and further price increases are expected as the impulsive wave progresses, reinforcing the continuation of the broader upward trend.
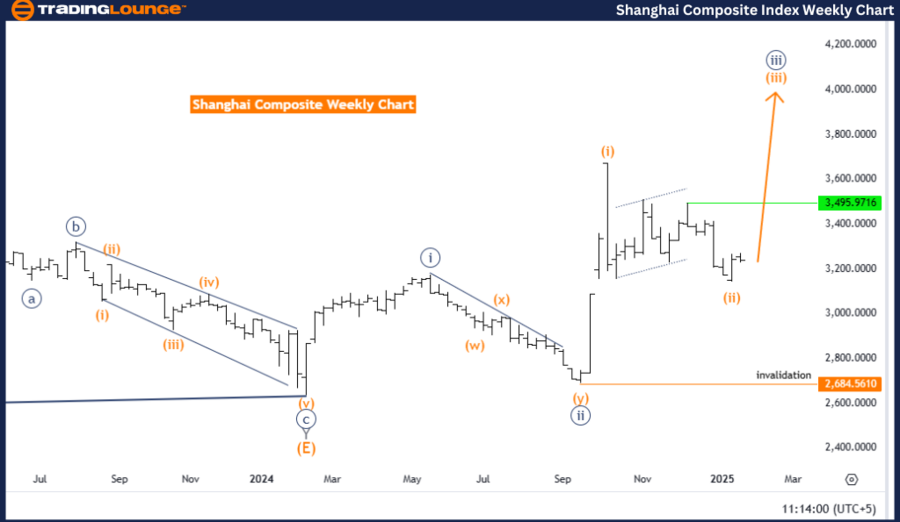
Shanghai Composite Elliott Wave Analysis Trading Lounge Weekly Chart
Shanghai Composite Elliott Wave technical analysis
Technical analysis overview
-
Function: Bullish Trend.
-
Mode: Impulsive.
-
Structure: Orange Wave 3.
-
Position: Navy Blue Wave 3.
-
Direction Next Higher Degrees: Orange Wave 3 (Started).
-
Details: Orange wave 2 appears completed, and orange wave 3 is now in progress.
-
Wave Cancel Invalid Level: 2684.5610
Analysis overview
The Shanghai Composite weekly chart analysis confirms a bullish trend, following Elliott Wave principles. The market is currently in an impulsive mode, signaling strong upward momentum. The ongoing wave structure, identified as orange wave 3, plays a crucial role in the continued upward movement, reflecting persistent market strength.
The position within the wave cycle is noted as navy blue wave 3, representing a critical stage in advancing the overall bullish trend. The active development of orange wave 3 within this larger wave structure underscores the market’s ongoing strength and suggests the potential for further upward progression.
With the completion of orange wave 2, the transition to orange wave 3 has begun, marking the initiation of a key bullish phase. This movement aligns with the higher-degree wave direction, reinforcing expectations for sustained price growth as the trend continues to develop.
Key invalidation level
A crucial invalidation level is set at 2684.5610, serving as a key benchmark for the analysis. If the price declines below this threshold, the current wave count will be invalidated, necessitating a reassessment of the market outlook. However, as long as the price remains above this level, the bullish wave structure remains intact and valid.
Conclusion
In summary, the Shanghai Composite weekly chart analysis highlights an ongoing bullish trend, driven by the development of orange wave 3 within the larger navy blue wave 3 framework. The successful completion of orange wave 2 has set the stage for the current upward phase, with further gains expected. The invalidation level at 2684.5610 serves as a critical point to monitor, ensuring the validity of the current bullish outlook. This wave structure continues to support a strong market, with potential for further upward momentum.
Shanghai Composite Index Elliott Wave technical analysis [Video]
Author

Peter Mathers
TradingLounge
Peter Mathers started actively trading in 1982. He began his career at Hoei and Shoin, a Japanese futures trading company.


