ServiceNow Inc. (NOW) Elliott Wave technical analysis [Video]
![ServiceNow Inc. (NOW) Elliott Wave technical analysis [Video]](https://editorial.fxsstatic.com/images/i/Economic-Indicator_Recession-5_XtraLarge.png)
ServiceNow Inc. (NOW) – Elliott Wave analysis – Daily chart
Function: Trend.
Mode: Motive.
Structure: Impulsive.
Position: Wave (v).
Direction: Uptrend.
Details: After the completion of Wave (iv), the price is expected to resume higher in Wave (v), targeting an advance equivalent to Wave (i).
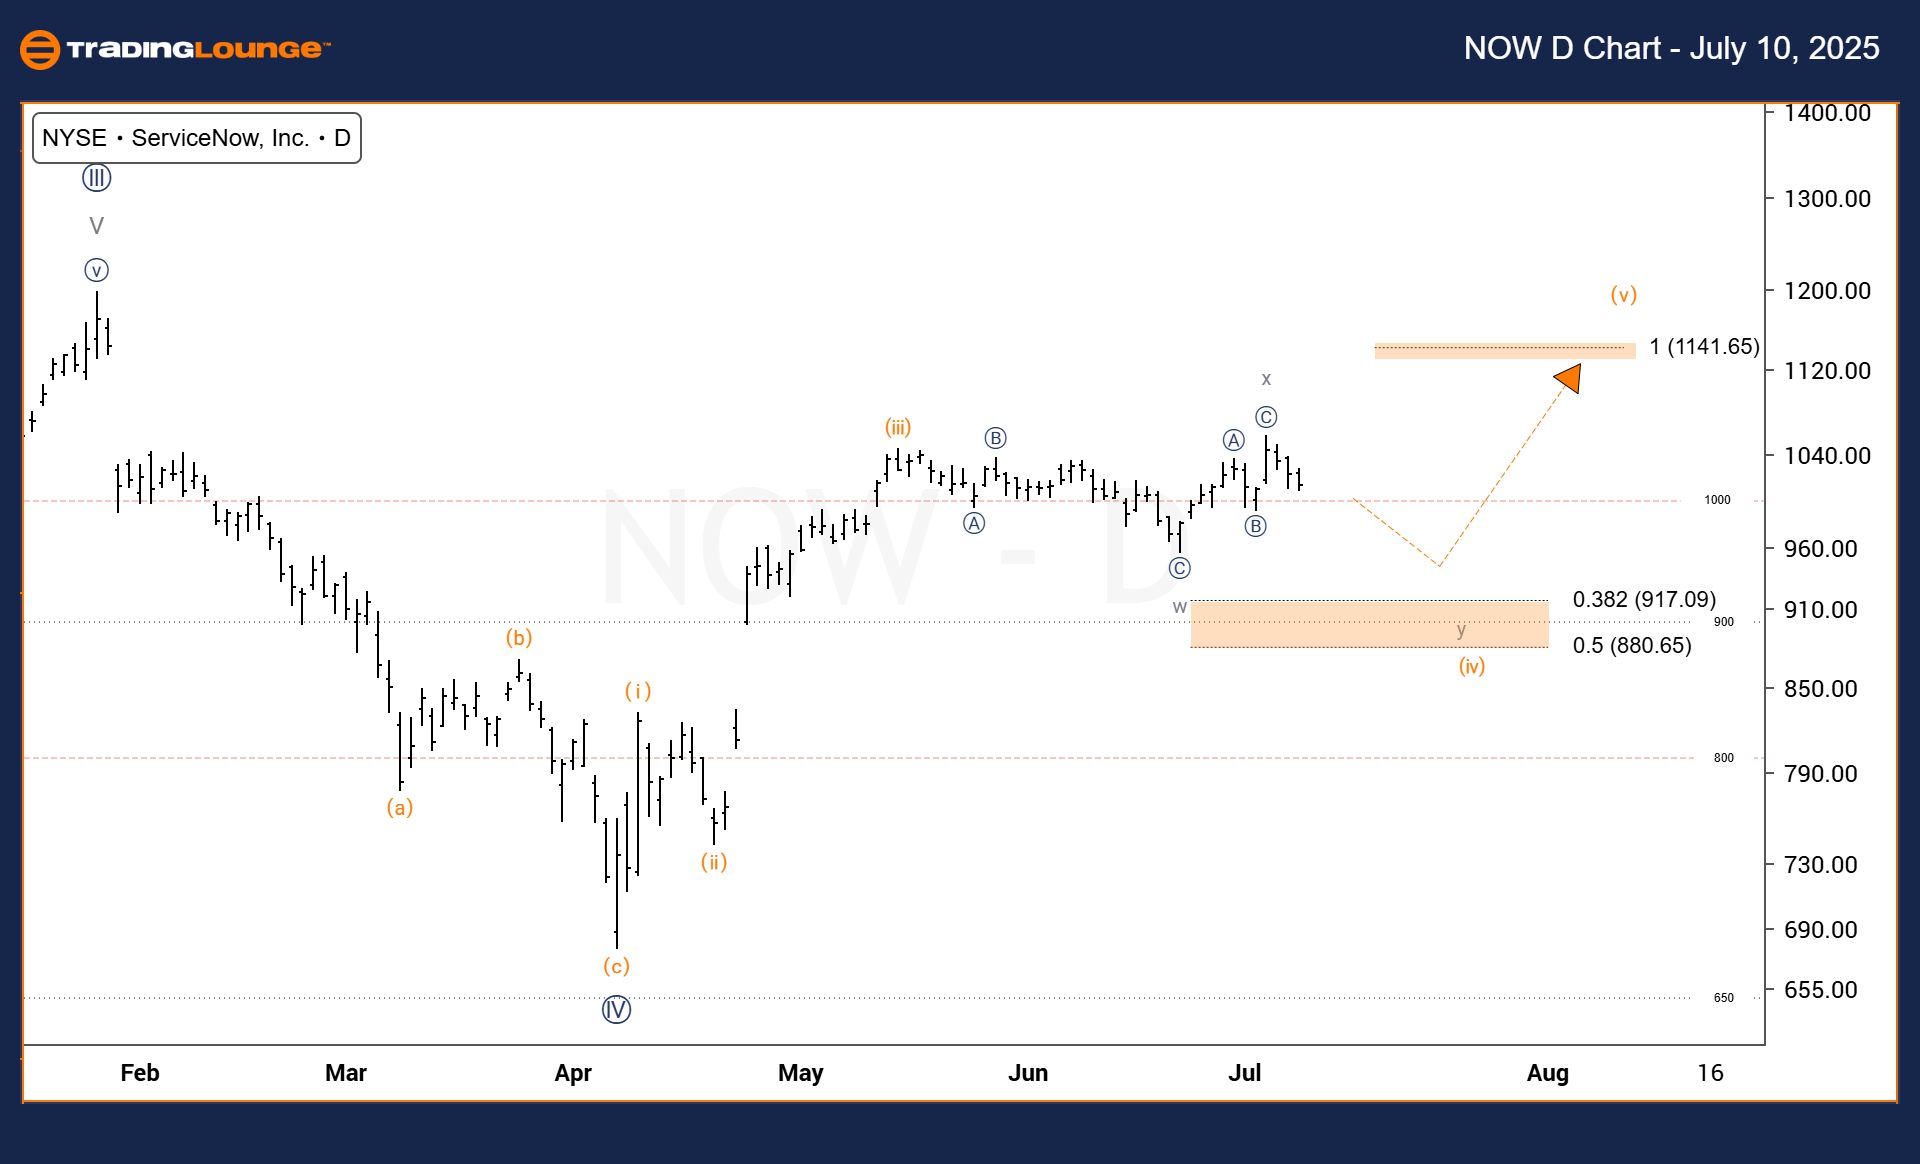
Daily chart overview
ServiceNow Inc. (NOW) is continuing its bullish momentum on the daily timeframe. The price action is progressing toward Wave (v), with Wave (iv) currently in a corrective phase. This correction may complete near the 38.2% to 50% Fibonacci retracement zone. Once Wave (iv) concludes, the next leg upward—Wave (v)—is expected to mirror the size of Wave (i), presenting a tactical opportunity for bullish setups. The ongoing motive wave structure indicates strong upward potential in the near term.
ServiceNow Inc. (NOW) – Elliott Wave analysis – Weekly chart
Function: Trend.
Mode: Motive.
Structure: Impulsive.
Position: Wave {V}.
Direction: Uptrend.
Details: The uptrend toward Wave {V} continues following a bounce near the 50% Fibonacci retracement level in April.
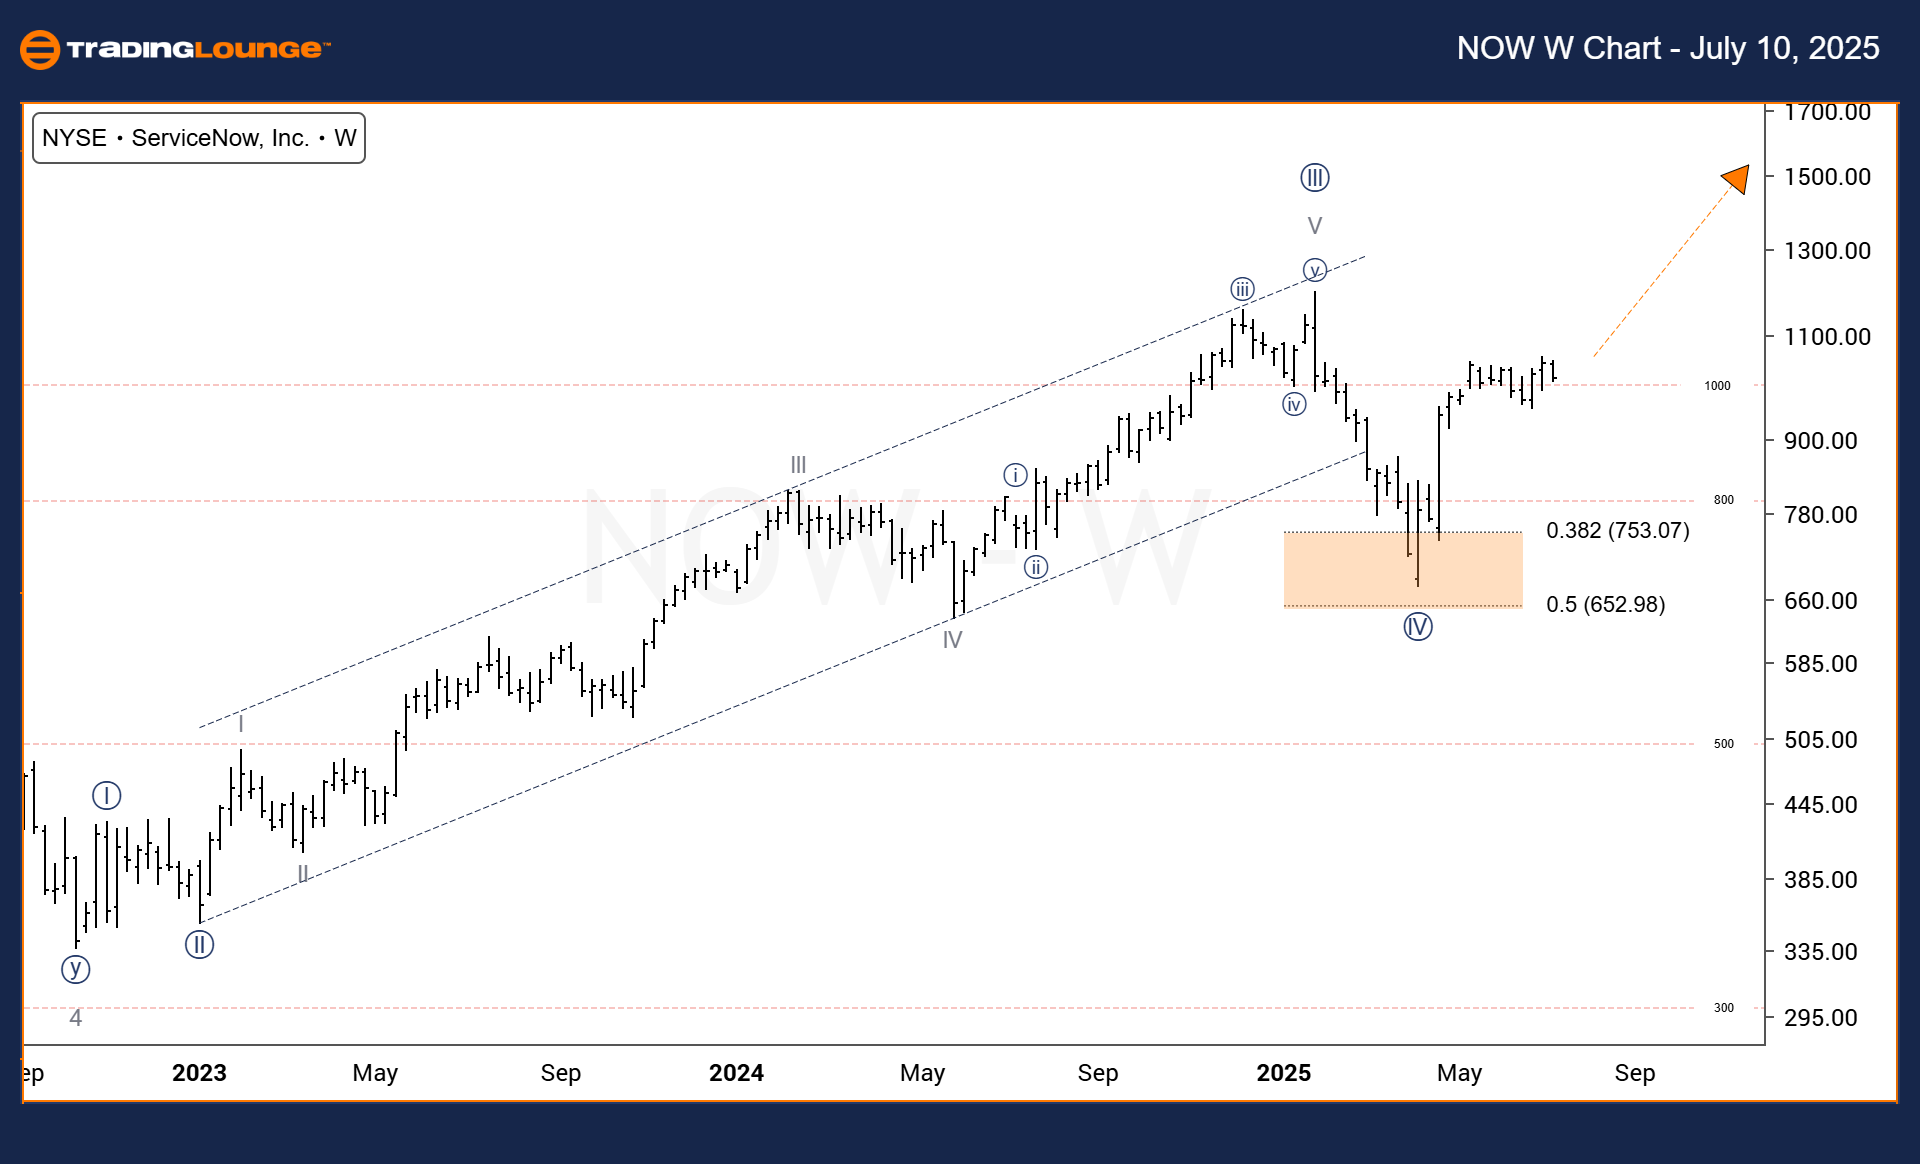
Weekly chart insight
In the weekly timeframe, NOW maintains a solid impulsive structure as the price moves toward the final Wave {V}. After establishing a base during Wave {IV} in April around the 50% Fibonacci retracement, the price has shown renewed strength. The current wave development aligns with a sustained bullish trend. However, traders should be alert to nearby resistance zones and potential signs of consolidation as the wave matures.
ServiceNow Inc. (NOW) Elliott Wave technical analysis [Video]
Author

Peter Mathers
TradingLounge
Peter Mathers started actively trading in 1982. He began his career at Hoei and Shoin, a Japanese futures trading company.


