Salesforce Inc. (CRM) Elliott Wave technical analysis [Video]
![Salesforce Inc. (CRM) Elliott Wave technical analysis [Video]](https://editorial.fxsstatic.com/images/i/Equity-Index_CAC40-2_XtraLarge.jpg)
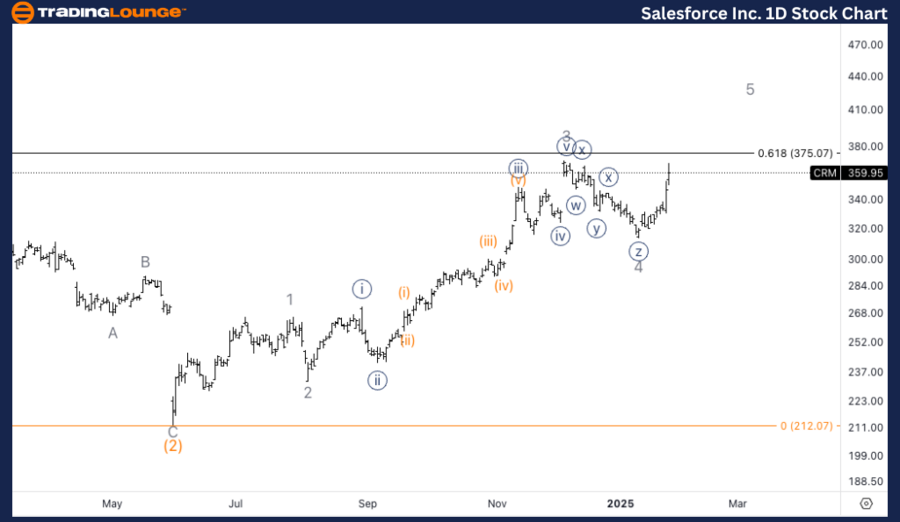
CRM Elliott Wave technical analysis
Function: Trend
Mode: Impulsive
Structure: Motive
Position: Wave 5 of (3).
Direction: Upside in wave 5
Details: Here we are looking at upside into wave 5 as we have a lot of margin for upside potential. There is a possibility the whole move up from the June 2023 should be counted one degree lower. Meaning we could be completing wave 1 of (3).
CRM Elliott Wave technical analysis – Daily chart
Salesforce Inc. (CRM) is expected to experience further upside in wave 5 of (3). There is significant margin for upward movement, but it's possible that the entire move up since June 2023 could be part of a lower-degree count. This alternative scenario would indicate that we are currently completing wave 1 of (3), implying more growth in the future as wave (3) unfolds.
CRM Elliott Wave technical analysis
Function: Trend.
Mode: Impulsive.
Structure: Motive.
Position: Wave {i} of 5.
Direction: Completion in wave {i}.
Details: Looking for completion in wave {i} to then continue higher within wave 5 after the pullback in wave {ii}. We could be facing resistance as we head towards the end MG2 at 380$.
CRM Elliott Wave technical analysis – One-hour chart
The 1-hour chart for CRM suggests the completion of wave {i} within wave 5, followed by a pullback in wave {ii} before the uptrend resumes. Resistance could emerge around the MG2 level at $380 as the stock progresses higher.

This analysis focuses on the current trend structure of Salesforce Inc., (CRM) utilizing the Elliott Wave Theory on both the daily and 1-hour charts. Below is a breakdown of the stock's position and potential future movements.
Salesforce Inc. (CRM) Elliott Wave technical analysis [Video]
Author

Peter Mathers
TradingLounge
Peter Mathers started actively trading in 1982. He began his career at Hoei and Shoin, a Japanese futures trading company.


