|

Russell Futures ($RTY_F) completed correction right at the Equal Legs zone

In this technical article we’re going to take a look at the Elliott Wave charts charts of RUSSELL Futures $RTY_F published in members area of the website.  As our members know we are favoring the long side in Indices. $RTY is another instrument that has given us good trading setup recently. RUSSELL  made clear 3 waves down from the March 8th peak peak and completed correction right at the Equal Legs zone ( Blue Box Area) . In further text we’re going to explain the  Elliott Wave pattern  and trading setup.

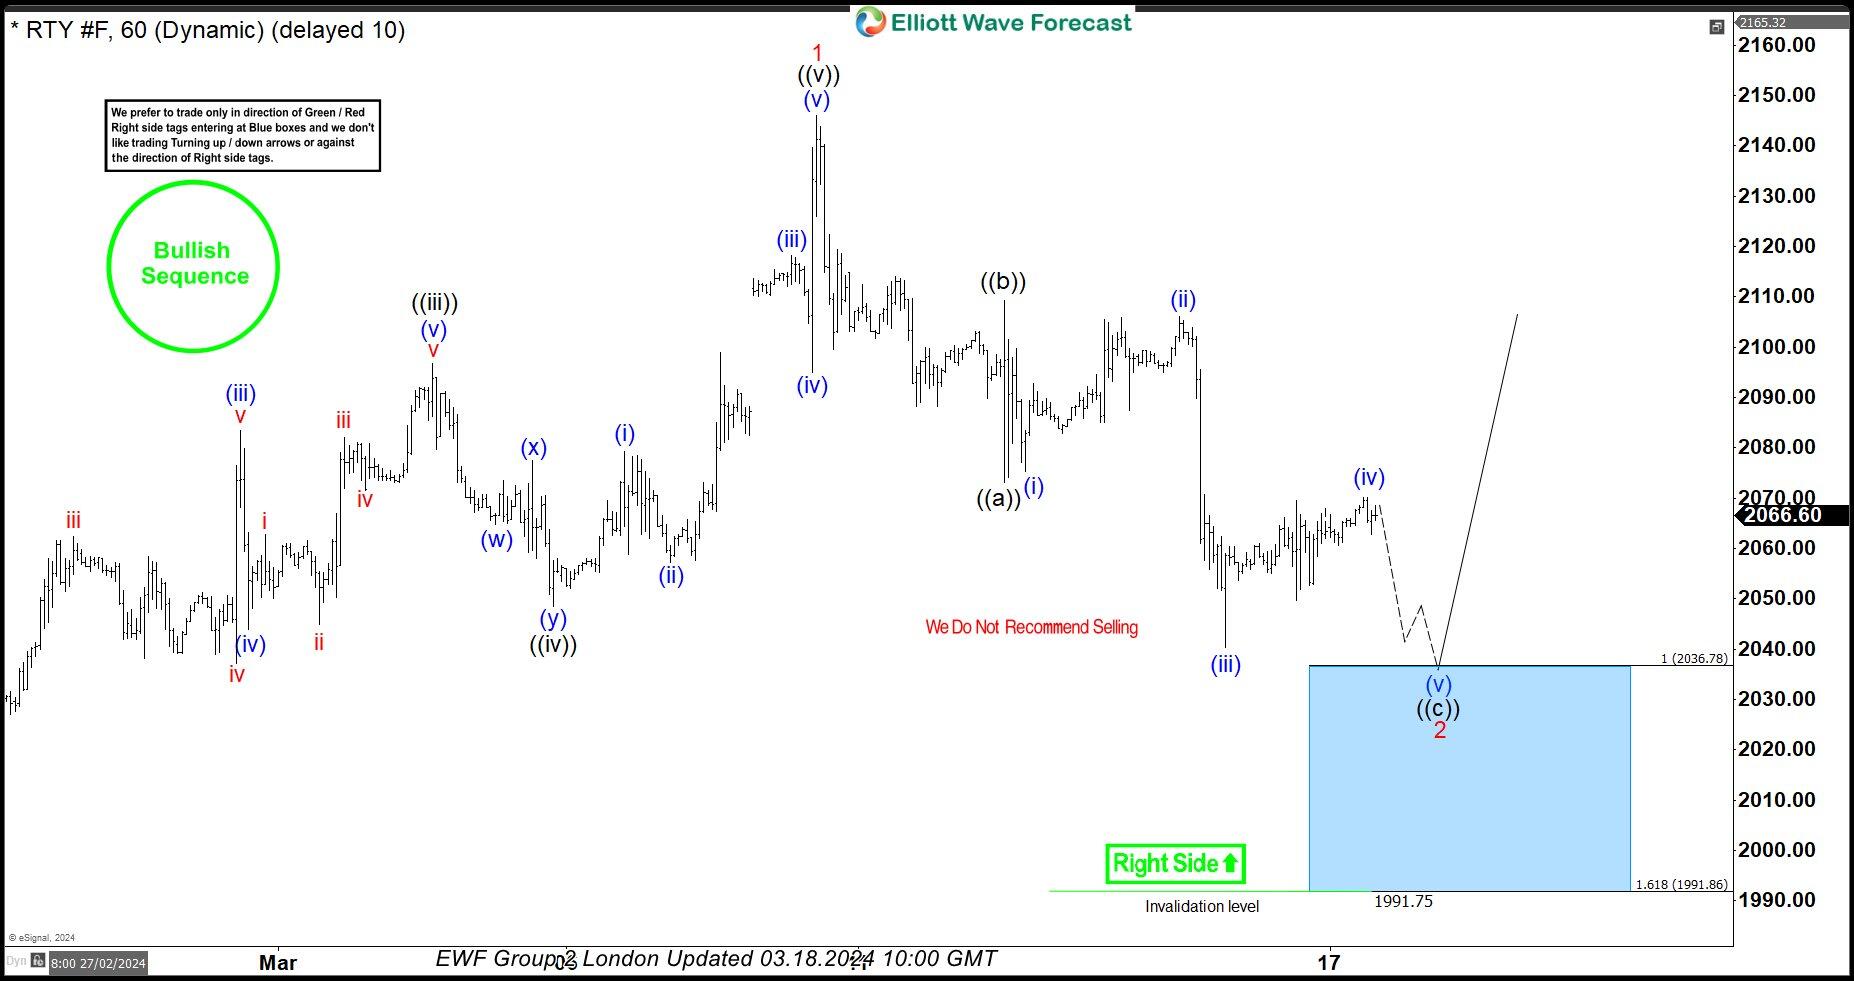
Russell Elliott Wave one-hour chart 03.18.2024

RUSSELL is showing lower low sequences from the peak, suggesting short term pull back is still in progress. Correction has ((a))((b))((c)) labeling. The price structure is incomplete at the moment, calling for another leg down toward : 2036.78-1991.86. We don’t recommend selling RTY_F and prefer the long side from the marked Blue Box ( buying zone). Once RUSSELL reaches our buying area, it should ideally make either rally toward new highs or in 3 waves bounce alternatively. Once bounce reaches 50 Fibs against the ((b)) black high, we will make long position risk free ( put SL at BE) and take partial profits.

Chart

Russell Elliott Wave one-hour chart 02.28.2024

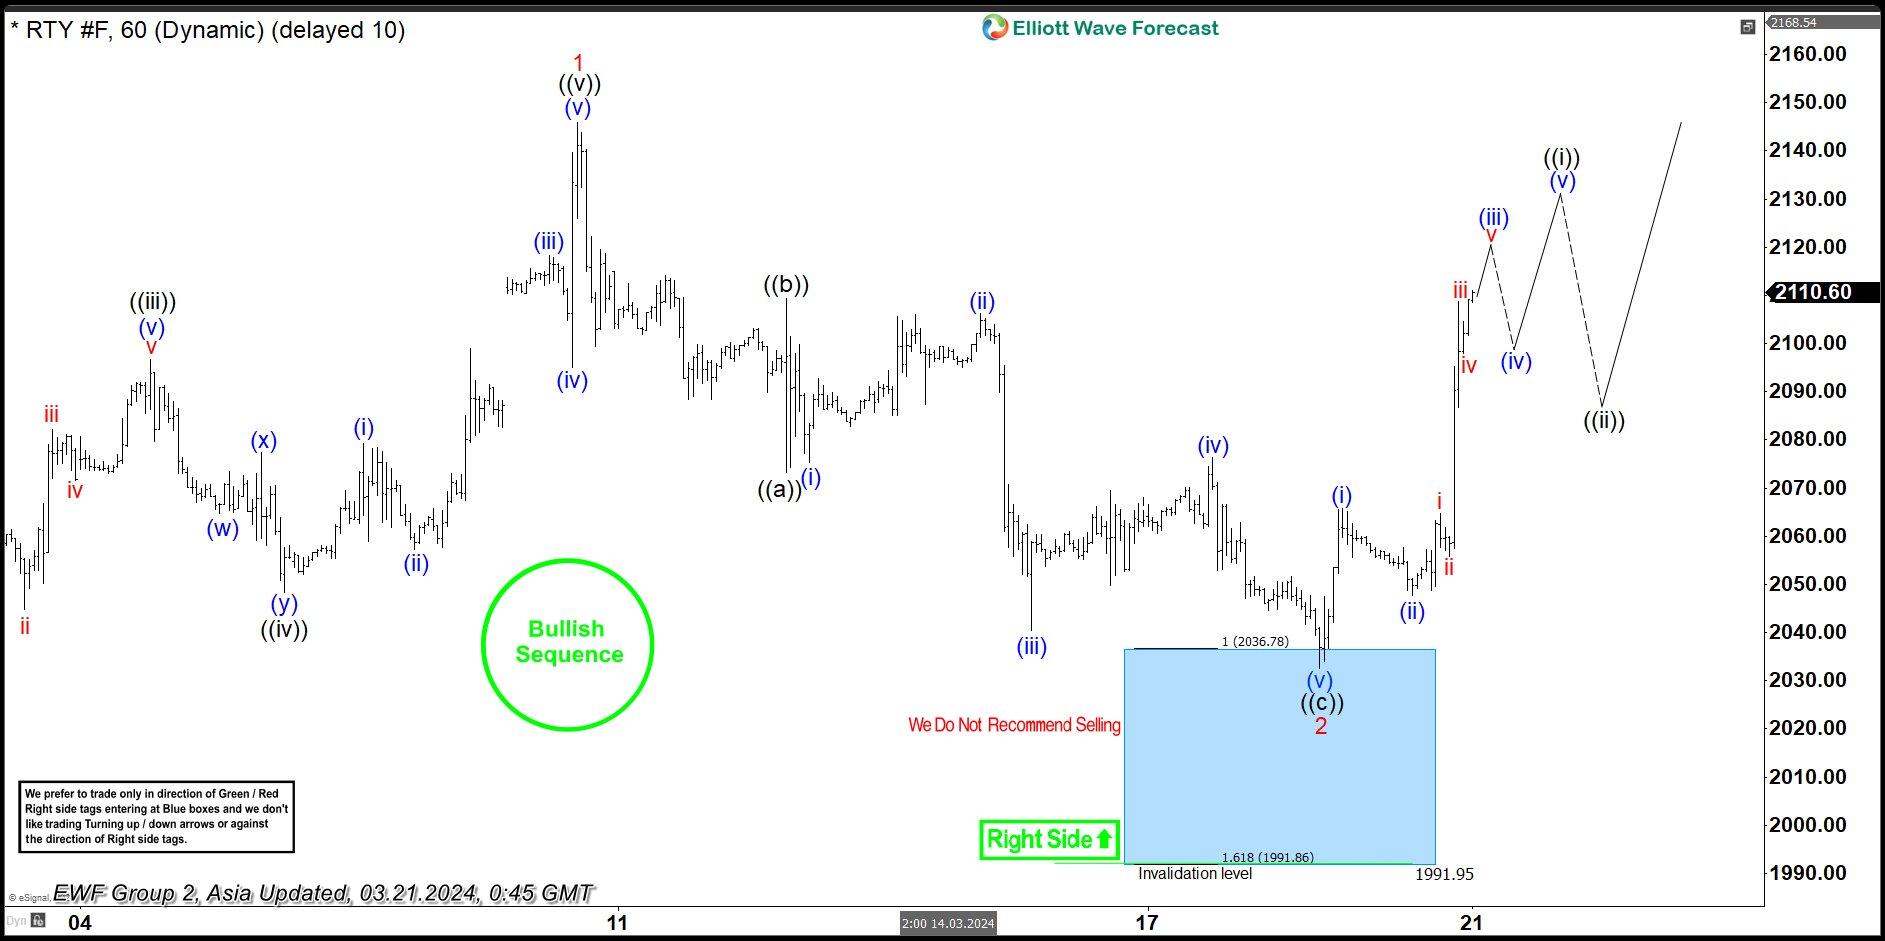
RUSSELL reached our buying zone at : 2036.78-1991.86 and found buyers as expected. RTY_F is giving us very good reaction from the Blue Box Area. We call pull back 2 red completed at the 2033.3 low. Consequently, any long positions should be risk free by now. We would like to see break of 1 red  peak (March 8th) to confirm next leg up is in progress. Once it breaks above 03.08. peak, we can look to buy intraday dips again in 3,7,11 swings against the 2033.3 low.

Chart

Author

Elliott Wave Forecast Team

Elliott Wave Forecast Team

ElliottWave-Forecast.com

More from Elliott Wave Forecast Team
Share:

Markets move fast. We move first.

Orange Juice Newsletter brings you expert driven insights - not headlines. Every day on your inbox.

By subscribing you agree to our Terms and conditions.

Editor's Picks

EUR/USD rebounds after falling toward 1.1700

EUR/USD gains traction and trades above 1.1730 in the American session, looking to end the week virtually unchanged. The bullish opening in Wall Street makes it difficult for the US Dollar to preserve its recovery momentum and helps the pair rebound heading into the weekend.

GBP/USD steadies below 1.3400 as traders assess BoE policy outlook

Following Thursday's volatile session, GBP/USD moves sideways below 1.3400 on Friday. Investors reassess the Bank of England's policy oıtlook after the MPC decided to cut the interest rate by 25 bps by a slim margin. Meanwhile, the improving risk mood helps the pair hold its ground.

Gold stays below $4,350, looks to post small weekly gains

Gold struggles to gather recovery momentum and stays below $4,350 in the second half of the day on Friday, as the benchmark 10-year US Treasury bond yield edges higher. Nevertheless, the precious metal remains on track to end the week with modest gains as markets gear up for the holiday season.

Crypto Today: Bitcoin, Ethereum, XRP rebound amid bearish market conditions

Bitcoin (BTC) is edging higher, trading above $88,000 at the time of writing on Monday. Altcoins, including Ethereum (ETH) and Ripple (XRP), are following in BTC’s footsteps, experiencing relief rebounds following a volatile week.

How much can one month of soft inflation change the Fed’s mind?

One month of softer inflation data is rarely enough to shift Federal Reserve policy on its own, but in a market highly sensitive to every data point, even a single reading can reshape expectations. November’s inflation report offered a welcome sign of cooling price pressures. 

XRP rebounds amid ETF inflows and declining retail demand demand

XRP rebounds as bulls target a short-term breakout above $2.00 on Friday. XRP ETFs record the highest inflow since December 8, signaling growing institutional appetite.