|

Russell 2000 (RTY) rally should fail for more downside [Video]

Short term Elliott Wave View in Russell 2000 (RTY) suggests the decline from 12.28.2023 high is unfolding as a double three Elliott Wave structure. Down from 12.28.2023 high, wave W ended at 1938.6 and wave X ended at 2004.87. Wave Y lower is in progress as another double three in lesser degree. Down from wave X, wave a ended at 1966.4 and wave b ended at 2003.10. Wave c lower ended at 1944.70 which completed wave (w). From there, wave (x) rally ended at t 2003.30 as a zigzag. Up from wave (w), wave a ended at 1977.10 and wave b ended at 1957.30. Wave c ended at 2003.30 which completed wave (x) in higher degree.

Russell 2000 (RTY_F) 45 minutes Elliott Wave chart

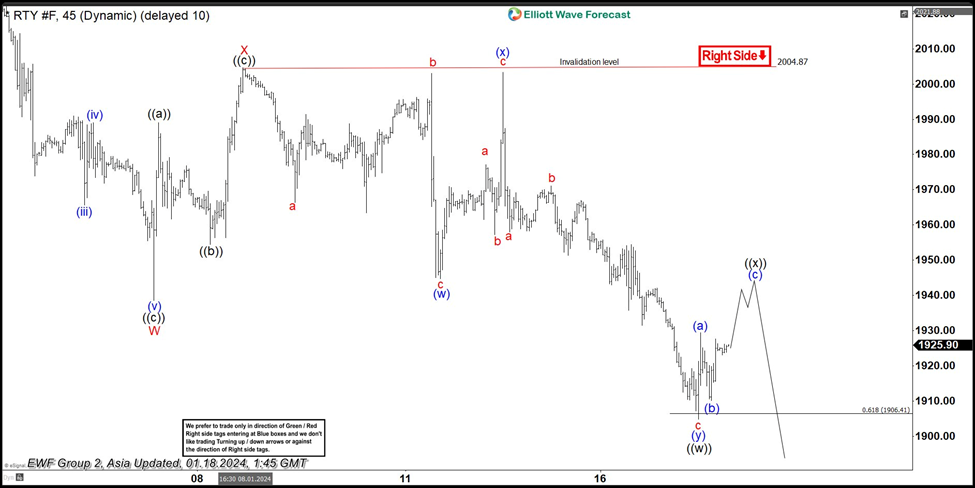
Index resumes lower in wave (y) with internal subdivision as a zigzag. Down from wave (x), wave a ended at 1958 and wave b rally ended at 1971.10. Wave c lower ended at 1904.80 which completed wave (y) of ((w)). Expect Index to rally in wave ((x)) to correct cycle from 1.9.2024 high before it resumes lower. Rally is unfolding as a zigzag where wave (a) ended at 1929.4 and wave (b) ended at 1910.10. Expect wave (c) higher to end at 1934.2 – 1949.9 area which should complete wave ((x)) in higher degree. Near term, as far as pivot at 2004.87 high stays intact, expect rally to fail in 3, 7, 11 swing for further downside.

RTY_F Elliott Wave video

Author

Elliott Wave Forecast Team

Elliott Wave Forecast Team

ElliottWave-Forecast.com

More from Elliott Wave Forecast Team
Share:

Editor's Picks

EUR/USD treads water above 1.1850 amid thin trading

EUR/USD stays defensive but holds 1.1850 amid quiet markets in the European hours on Monday.  The US Dollar is struggling for direction due to thin liquidity conditions as US markets are closed in observance of Presidents' Day. 

GBP/USD flat lines as traders await key UK and US macro data

GBP/USD kicks off a new week on a subdued note and oscillates in a narrow range near 1.365 in Monday's European trading. The mixed fundamental backdrop warrants some caution for aggressive traders as the market focus now shifts to this week's important releases from the UK and the US.

Gold sticks to intraday losses; lacks follow-through

Gold remains depressed through the early European session on Monday, though it has managed to rebound from the daily trough and currently trades around the $5,000 psychological mark. Moreover, a combination of supporting factors warrants some caution for aggressive bearish traders, and before positioning for deeper losses.

Bitcoin consolidates as on-chain data show mixed signals

Bitcoin price has consolidated between $65,700 and $72,000 over the past nine days, with no clear directional bias. US-listed spot ETFs recorded a $359.91 million weekly outflow, marking the fourth consecutive week of withdrawals.

The week ahead: Key inflation readings and why the AI trade could be overdone

It is likely to be a quiet start to the week, with US markets closed on Monday for Presidents Day. European markets are higher across the board and gold is clinging to the $5,000 level after the tamer than expected CPI report in the US reduced haven flows to precious metals.

Monero Price Forecast: XMR risks a drop below $300 under mounting bearish pressure

Monero (XMR) starts the week under pressure, recording a 4% decline at press time on Monday after a 7% drop the previous day, putting the $300 support zone in focus.