Russell 2000 index Elliott Wave technical analysis [Video]
![Russell 2000 index Elliott Wave technical analysis [Video]](https://editorial.fxstreet.com/images/Markets/Equities/Industries/ConsumerServices/pic-man-call-center-637435344352918424.jpg)
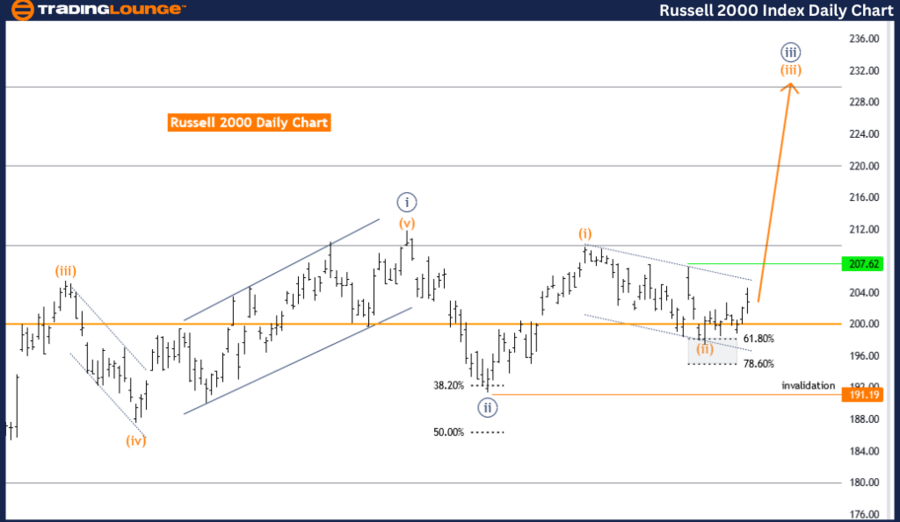
RUSSELL 2000 Elliott Wave Analysis Trading Lounge Day Chart
Russell 2000 Elliott Wave technical analysis
Function: Trend.
Mode: Impulsive.
Structure: Orange Wave 3.
Position: Navy Blue Wave 3.
Direction next higher degrees: Orange wave 3 (started).
Details: Orange wave 2 completed between Fibonacci levels 61.80 to 78.60, now orange wave 3 is active. Wave cancel invalid level: 191.19
The Elliott Wave analysis for the Russell 2000 index on the daily chart offers insights into the current market trend and its future movements based on Elliott Wave Theory. This analysis classifies the market function as a trend, indicating a specific directional movement rather than stagnation or sideways motion.
The market mode is identified as impulsive, characterized by strong and decisive movements in the primary trend direction. Impulsive waves typically represent the main market direction, followed by corrective waves moving against the trend.
The market structure is labeled as orange wave 3. In Elliott Wave Theory, this denotes a powerful and extended wave within the larger trend cycle, representing significant price movements in the trend direction.
The position within this structure is navy blue wave 3, indicating the market is in the third wave of a larger trend cycle. The third wave is usually the strongest and longest in the Elliott Wave sequence, suggesting robust market activity.
The next higher degree direction is orange wave 3, which has already started. This implies the market is in an impulsive phase, expected to continue moving strongly in the trend direction.
Details of the analysis show that orange wave 2 appears completed between Fibonacci levels 61.80 to 78.60. These levels commonly identify potential market reversal points, indicating support and a move into the next impulsive phase.
Currently, orange wave 3 is active, suggesting significant upward movement in the market as part of the ongoing trend.
A critical aspect is the wave cancellation invalid level set at 191.19. If the market moves below this point, the current wave count is invalidated, necessitating a reassessment of the wave structure.
In summary, the Russell 2000 daily chart analysis indicates an impulsive trend phase within orange wave 3, positioned in navy blue wave 3. The market completed orange wave 2 between Fibonacci levels 61.80 to 78.60, and orange wave 3 is now active. The wave cancel invalid level is set at 191.19, crucial for validating the current wave count.
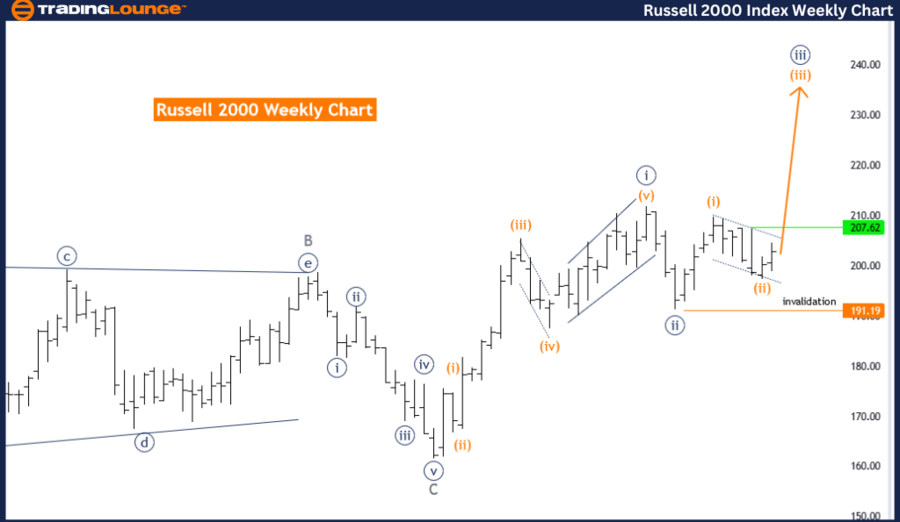
RUSSELL 2000 Elliott Wave Analysis Trading Lounge Weekly Chart
Russell 2000 Elliott Wave technical analysis
Function: Trend.
Mode: Impulsive.
Structure: Orange Wave 3.
Position: Navy Blue Wave 3.
Direction next higher degrees: Orange wave 3 (started).
Details: Orange wave 2 completed between Fibonacci levels 61.80 to 78.60, now orange wave 3 is active. Wave cancel invalid level: 191.19
The Elliott Wave analysis for the Russell 2000 index on the weekly chart reveals a clear and strong market trend. The function of the market is identified as a trend, indicating consistent directional movement rather than random or sideways activity.
The market mode is impulsive, characterized by strong, directional movements. Impulsive waves typically signify the market's primary direction.
The market structure is defined as orange wave 3. In Elliott Wave Theory, this represents a significant and extended movement in the trend direction, indicating strong market momentum.
The position within this structure is navy blue wave 3, suggesting the market is in the third wave of a larger trend cycle. The third wave is often the most powerful and longest, signifying robust and sustained market activity.
The direction for the next higher degrees is orange wave 3, which has already begun. This implies the market is currently in an impulsive phase, expected to continue its strong upward movement as part of the ongoing trend.
Details indicate that orange wave 2 is completed between Fibonacci levels 61.80 to 78.60. These levels commonly identify potential reversal points, suggesting the market has found support and is advancing into the next impulsive phase.
Currently, orange wave 3 is active, indicating significant upward movement, expected to drive the market higher and continue the existing trend.
A crucial aspect is the wave cancellation invalid level set at 191.19. If the market moves below this point, the current wave structure would be invalidated, necessitating a reassessment of the wave count.
In summary, the Russell 2000 weekly chart analysis shows the market in an impulsive trend phase within orange wave 3, positioned in navy blue wave 3. The market completed orange wave 2 between Fibonacci levels 61.80 to 78.60, and orange wave 3 is now in play. The wave cancel invalid level is set at 191.19, crucial for validating the current wave count.
Technical analyst: Malik Awais.
Russell 2000 Elliott Wave technical analysis [Video]
Author

Peter Mathers
TradingLounge
Peter Mathers started actively trading in 1982. He began his career at Hoei and Shoin, a Japanese futures trading company.


