|

Russell 2000 futures (RTY) turning lower after three waves rally [Video]

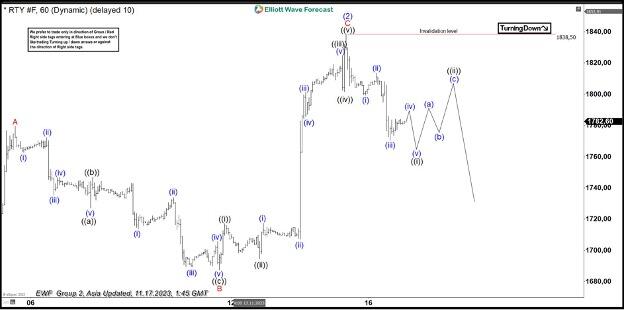
Russell 2000 futures (RTY) rally from 10.28.2023 low has ended in 3 waves at the 100% – 161.8% Fibonacci extension. This suggests that the rally is corrective in nature. Up from 10.28.2023 low, wave A ended at 1779.6. Pullback in wave B ended at 1687.40 with internal subdivision as a zigzag Elliott Wave structure. Down from wave A, wave ((a)) ended at 1727.10 and rally in wave ((b)) ended at 1746.8. Wave ((c)) lower ended at 1687.40 and this completed wave B in higher degree.

The Index then turned higher in wave C. Up from wave B, wave ((i)) ended at 1717.10, and dips in wave ((ii)) ended at 1694.5. Index extended higher in wave ((iii)) towards 1824.80 and pullback in wave ((iv)) ended at 1801.60. Final leg wave ((v)) ended at 1838.50 which completed wave C of (2) in higher degree. The Index has turned lower in wave (3). Down from wave (2), wave (i) ended at 1799.40 and rally in wave (ii) ended at 1813.50. Index extended lower in wave (iii) towards 1770.50. Expect wave (iv) rally to be followed with wave (v) lower to end wave ((i)). Afterwards, it should rally in wave ((ii)) to correct cycle from 11.16.2023 high in 3, 7, or 11 swing before it resumes lower again.

Russell 2000 futures (RTY) 60 minutes Elliott Wave chart

RTY_F Elliott Wave video

Author

Elliott Wave Forecast Team

Elliott Wave Forecast Team

ElliottWave-Forecast.com

More from Elliott Wave Forecast Team
Share:

Markets move fast. We move first.

Orange Juice Newsletter brings you expert driven insights - not headlines. Every day on your inbox.

By subscribing you agree to our Terms and conditions.

Editor's Picks

EUR/USD bounces toward 1.1750 as US Dollar loses strength

EUR/USD returned to the 1.1750 price zone in the American session on Friday, despite falling Wall Street, which indicates risk aversion. Trading conditions remain thin following the New Year holiday and ahead of the weekend, with the focus shifting to US employment and European data scheduled for next week.

GBP/USD nears 1.3500, holds within familiar levels

After testing 1.3400 on the last day of 2025, GBP/USD managed to stage a rebound. Nevertheless, the pair finds it difficult to gather momentum and trades with modest intraday gains at around 1.3490 as market participants remain in holiday mood.

Gold trims intraday gains, approaches $4,300

Gold retreated sharply from the $4,400  area and trades flat for the day in the $4,320 price zone. Choppy trading conditions exacerbated the intraday decline, although XAU/USD bearish case is out of the picture, considering growing expectations for a dovish Fed and persistent geopolitical tensions.

Cardano gains early New Year momentum, bulls target falling wedge breakout

Cardano kicks off the New Year on a positive note and is extending gains, trading above $0.36 at the time of writing on Friday. Improving on-chain and derivatives data point to growing bullish interest, while the technical outlook keeps an upside breakout in focus.

Economic outlook 2026-2027 in advanced countries: Solidity test

After a year marked by global economic resilience and ending on a note of optimism, 2026 looks promising and could be a year of solid economic performance. In our baseline scenario, we expect most of the supportive factors at work in 2025 to continue to play a role in 2026.

Crypto market outlook for 2026

Year 2025 was volatile, as crypto often is.  Among positive catalysts were favourable regulatory changes in the U.S., rise of Digital Asset Treasuries (DAT), adoption of AI and tokenization of Real-World-Assets (RWA).