Rea Group Ltd Elliott Wave technical forecast [Video]
![Rea Group Ltd Elliott Wave technical forecast [Video]](https://editorial.fxstreet.com/images/TechnicalAnalysis/ChartPatterns/Chartism/rates-of-currency-market-for-buying-and-selling-64520319_XtraLarge.jpg)
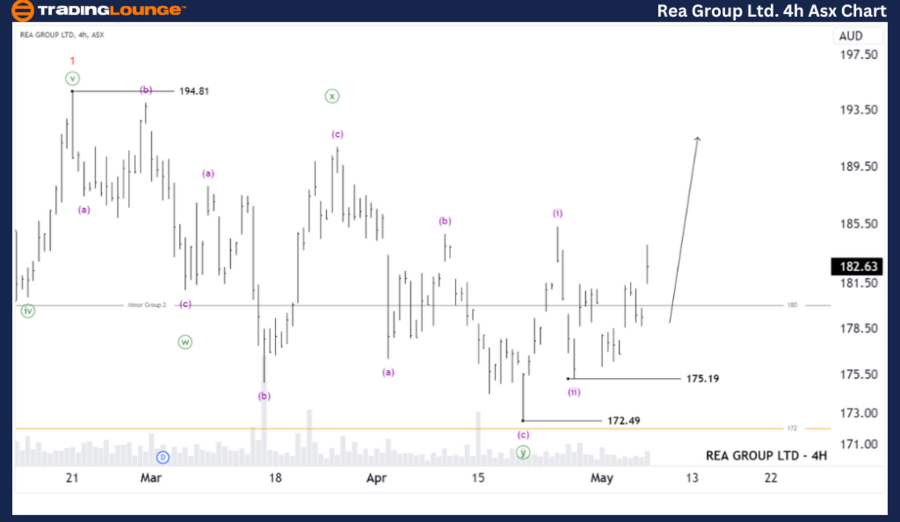
Greetings, Our Elliott Wave analysis today updates the Australian Stock Exchange (ASX) with REA GROUP LTD – REA. We identified that wave 2-red may have just ended, and wave 3-red could push much higher.
REA Elliott Wave technical analysis
Function: Major trend (Minor degree, red).
Mode: Motive.
Structure: Impulse.
Position: Wave (iii)-purple of Wave 3-red.
Details: The outlook suggests that wave 2-red has recently concluded, and wave 3-red is now unfolding to push higher. It is subdividing into waves (i) and (ii)-purple, which have ended, and wave (iii)-purple is opening up to push higher. Maintaining a price above 172.49 would be a significant advantage for this outlook.
Invalidation point: 140.50.

ASX: REA four-hour chart analysis
Function: Major trend (Minuette degree, purple).
Mode: Motive.
Structure: Impulse.
Position: Wave (iii)-purple.
Details: The shorter-term outlook suggests that wave (ii)-purple has just ended, and wave (iii)-purple may be unfolding to push higher. However, there's some uncertainty regarding whether wave (ii) has truly concluded. Therefore, it would be preferable to see the price continue to push slightly higher to clarify this perspective. Following that, I would need to observe an ABC correction to prepare for finding a trade setup with better entry and stop levels than the current ones.
Invalidation point: 172.49.
Conclusion
Our analysis, forecast of contextual trends, and short-term outlook for ASX: REA GROUP LTD – REA aim to provide readers with insights into the current market trends and how to capitalize on them effectively. We offer specific price points that act as validation or invalidation signals for our wave count, enhancing the confidence in our perspective. By combining these factors, we strive to offer readers the most objective and professional perspective on market trends.
Rea Group Ltd Elliott Wave technical forecast [Video]
Author

Peter Mathers
TradingLounge
Peter Mathers started actively trading in 1982. He began his career at Hoei and Shoin, a Japanese futures trading company.


