QQQ buying the dips after Elliott Wave zig zag pattern
In this technical blog we’re going to take a quick look at the Elliott Wave charts of QQQ ETF , published in members area of the website. As our members know the ETF is showing impulsive bullish sequences in the cycle from the 254.07 low. Consequently , we were calling for the further rally in QQQ. Recently we got a pull back that has had a form of Elliott Wave Zig Zag pattern. In the further text we are going to explain the Elliott Wave Pattern and the trading strategy.
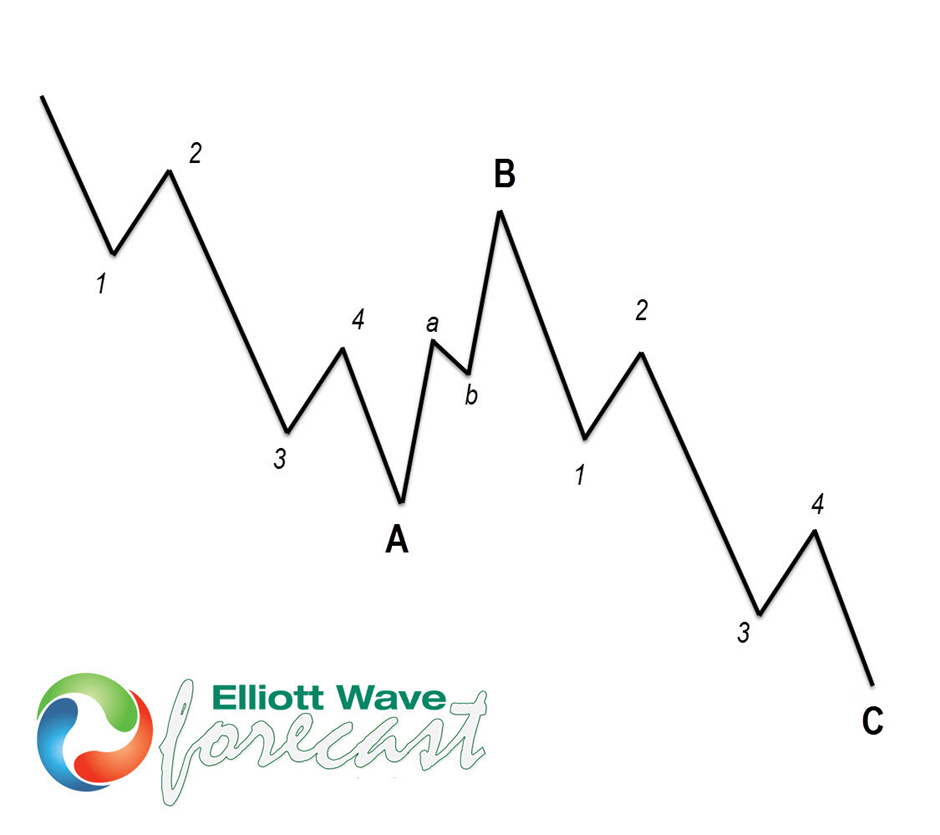
Before we take a look at the real market example, let’s explain Elliott Wave Zigzag.
Elliott Wave Zigzag is the most popular corrective pattern in Elliott Wave theory . It’s made of 3 swings which have 5-3-5 inner structure. Inner swings are labeled as A,B,C where A =5 waves, B=3 waves and C=5 waves. That means A and C can be either impulsive waves or diagonals. (Leading Diagonal in case of wave A or Ending in case of wave C) . Waves A and C must meet all conditions of being 5 wave structure, such as: having RSI divergency between wave subdivisions, ideal Fibonacci extensions and ideal retracements.
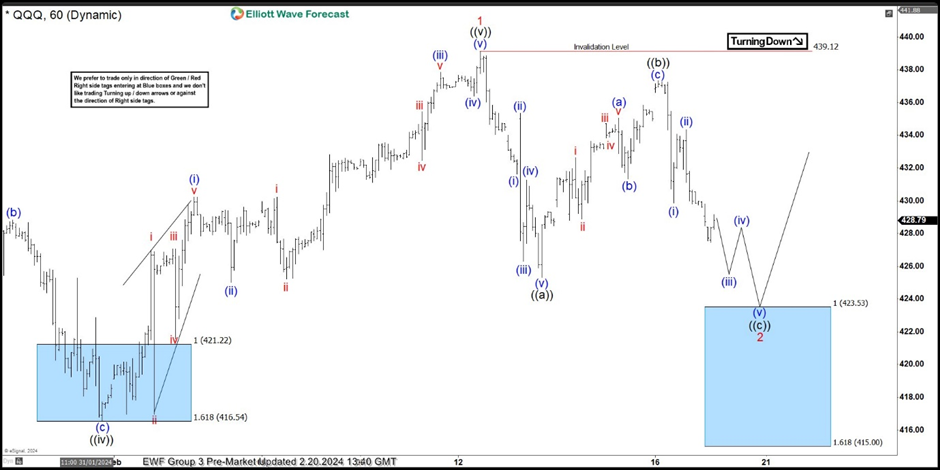
QQQ Elliott Wave one hour chart 02.20.2024
The ETF is currently giving us correction, wave 2 red pull back. Decline from the peak has a form of 5 waves, so we assume we got only the first leg of correction that is unfolding as Elliott Wave Zig Zag Pattern. That means both ((a)) and ((c)) legs should have 5 waves structures. We expect to see another leg down:((c)) black that will have a form of 5 waves. The ETF should ideally trade lower toward Equal legs area 423.53-415.00 ( Buying zone).
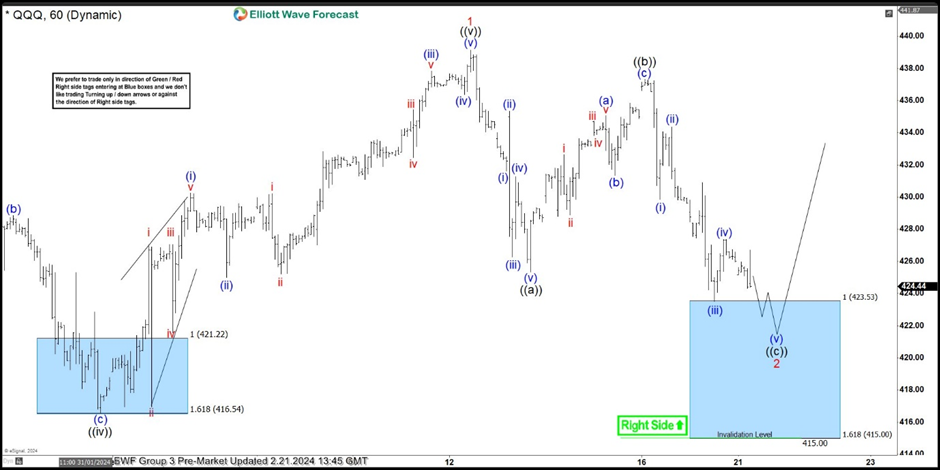
QQQ Elliott Wave one hour chart 02.21.2024
QQQ reached equal legs zone as expected. Another low would be ideal to complete 5 waves in ((c)) wave. We don’t recommend selling and favor the long side from the Blue Box : 423.53-415.00 area. As the main trend is bullish , we expect to get rally toward new highs ideally or 3 waves bounce at least. Once bounce reaches 50 Fibs against the ((b)) black high, we will make long position risk free ( put SL at BE) and take partial profits.
QQQ Elliott Wave one hour chart 02.21.2024
The ETF found buyers at the blue box and we got very good reaction from there. Consequently, any long positions from the equal legs area should be risk free by now. QQQ is now bullish against the 421.68 pivot. We expect ETF to keep finding buyers in intraday dips.

Author

Elliott Wave Forecast Team
ElliottWave-Forecast.com


