Q2: Keep an eye on Amazon(AMZN Stock), Mastercard (MA Stock) and Comcast (CMCSA Stock)

Mastercard (#Masterard), Comcast (#Comcast) and, most importantly, Amazon (#Amazon), which “ranked the most valuable company in the world and the value of its brand increased by about 64% on an annual basis, and the company also retained the first place for three consecutive years”, are about to release their earnings report for the second quarter 2021 on Thursday, July 29.
Amazon:
Amazon is one of the most important e-commerce and cloud computing sites, founded in 1994 in Washington by Jeff Bezos. Among its most prominent contributions since 2015, it has reduced the weights of the issued packages per shipment by more than 36% and removed more than one million tons of packaging, which is equivalent to 2 billion shipping boxes. All this besides, it was able to create nearly 400,000 jobs in the United States during the year 2020 alone.
On April 28, Amazon released its first quarterly report for 2021, which ranked it in the first place among the most valuable companies in the world, and its brand recorded an increase in value by about $683.9 billion. The company revealed its financial results for the first quarter of this year, which achieved net sales of about 108.5 billion dollars, representing an increase of 44% over the same quarter of last year, while its profits more than tripled to $8.1 billion. According to Zacks Investment Research, based on forecasts by 13 analysts, the combined EPS forecast for the quarter reporting on July 29 is $12.16. Earnings per share for the same quarter last year were $10.3.
Amazon Technical Analysis:
The following figure reviews the main axes and levels of support and resistance. The main pivot appears at 3,647.24 and resistances at 3,647.15, 3,692.92 and 3,719.83, while we find supports at 3,628.47, 3,601.56 and 3,582.79. The RSI fluctuates between the level of 0 and 100 and has made more than one peak above the 70 level during the second quarter of the year to express the excessive buying movement, and though it declined during the month of July it rose again during the past week to 63.43.
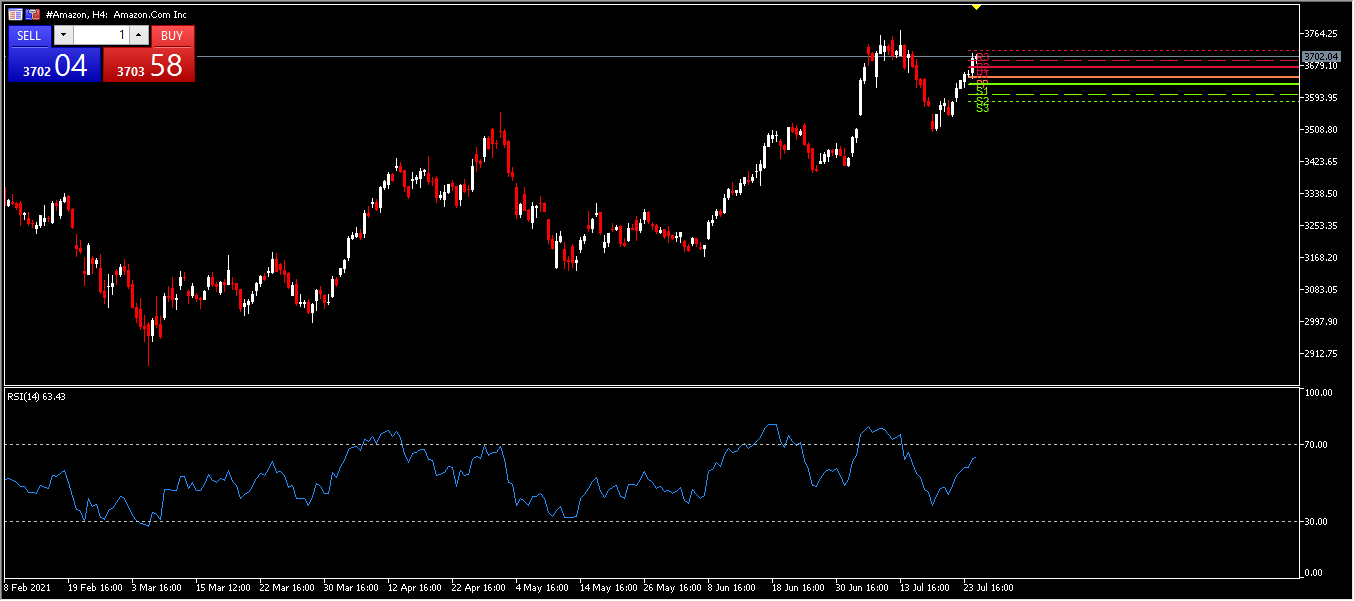
And then comes the Bollinger Bands indicator, with its current upper side at 3,746.81, which connects the tops of the stock price movement and indicates the maximum price, and we find the lower side of the channel at 3,505.37, which represents the lower limit of the price, and the mid-line of the channel comes at 3,626.09. The narrowing of the channel range appears on May 27, which indicates a rise in the price, as the narrowness of the channel was repeated at the beginning of July 21. The movement of the stock price has broken the middle line of the channel, which indicates a positive sign of a rise in the price, and the price has remained broken since July 23 to this day. The ATR shows a value of 43.64.
-637630938617977231.png)
MasterCard:
Mastercard (#Mastercard) is one of the largest companies in the world’s digital economy; it is an American company that provides financial services and facilities through payment through credit cards, founded by Wells Fargo, the Bank of California. Mastercard’s first quarter report showed net income of about $1.8 billion and $1.83 per share, and adjusted net income of $1.7 billion, or $1.74 per share. It has net revenue of $4.2 billion. According to Zacks Investment Research, based on forecasts from 15 analysts, the consolidated EPS forecast for the quarter is $1.72. Earnings per share for the same quarter last year were $1.35.
MasterCard Technical Analysis:
The following chart shows the main pivots and levels of support and resistance. The main pivot appears at 391.08 and resistances at 396.82, 400.18 and 405.92 while we find supports at 387.72, 381.98 and 378.92. While the RSI has made more than one peak at the level of 70 during the second quarter of the year to express the excessive buying movement, one on June 22 and the other on July 14, it fell during the month of July, but then returned to highs again during the past week, achieving a value of 62.10.
-637630938434967145.png)
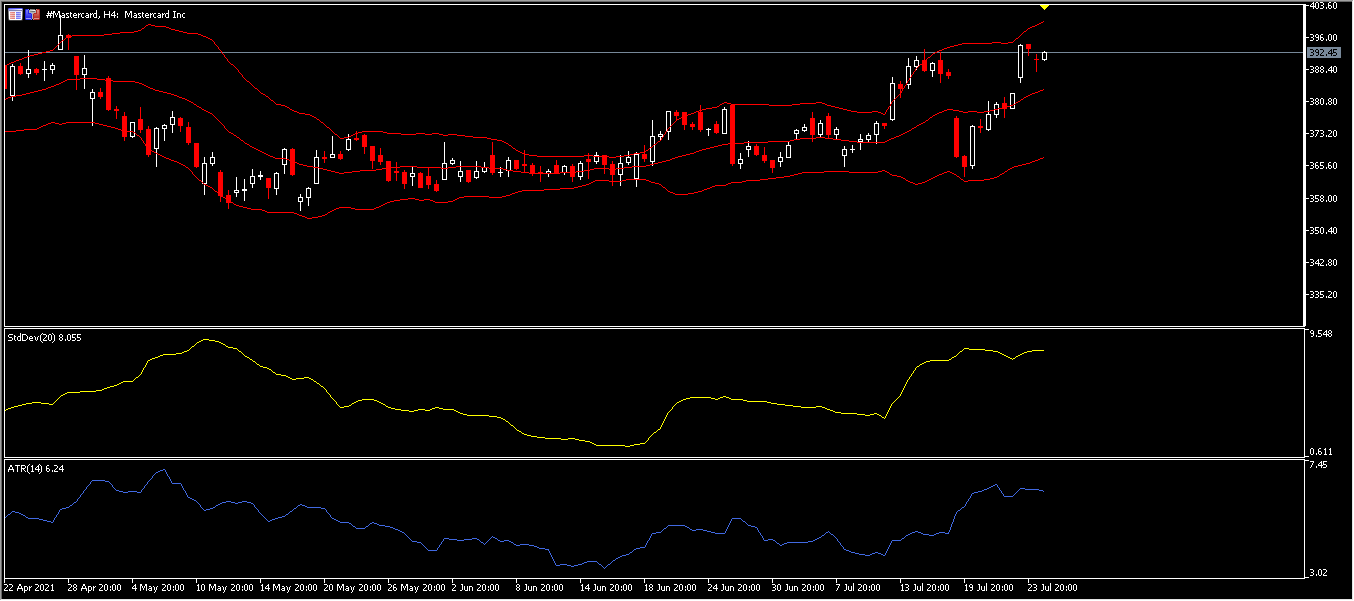
The Bollinger Bands indicator shows the extent of price volatility during the second quarter of 2021, which came relatively tight from its previous period, from June 9 to 18, to indicate a rise in price during the mentioned period and then began to widen to this day. The upper range of the volatility channel stops at 399.869, while the lower side comes at 367.650. The price fluctuation appears above and below the mid-line of the channel, indicating the high and low price during the period. theThe price settled above the mid-line of the channel recently, to highlight the rise in the share price during that period. We also see ATR at a value of 6.24.
Comcast:
Comcast (#Comcast) is an American company that operates on a global scale and is the largest company in the field of wireless communication and cable television. Founded in 1963 by Ralph Jay Roberts and Julian Brodsky, it is affiliated with the Nasdaq Stock Exchange and is headquartered in Philadelphia. In 2016, Comcast and NBCUniversal presented the largest, most technologically advanced and successful media event ever with the 2016 Summer Olympics. That same year Comcast acquired DreamWorks Animation in a $3.8 billion deal, to help create the next generation of successful animation with one of the world’s most recognized family brands.
Comcast’s quarterly report for the first quarter of the year 2021, which ended at the end of last March, included several statements regarding revenues, which amounted to 27,205 million US Dollars, compared to 26,609 million US Dollars in the same quarter of last year, which is equivalent to an increase of 2.2%. The net income was about $3,329 million, while the average was $3,529 million. It also achieved a return of about $0.71 per share, averaged at $0.76 per share. According to Zacks Investment Research, based on forecasts by 16 analysts, the forecast for total earnings per share for the quarter is $0.67. Earnings per share for the same quarter last year were $0.69.
Comcast Technical Analysis:
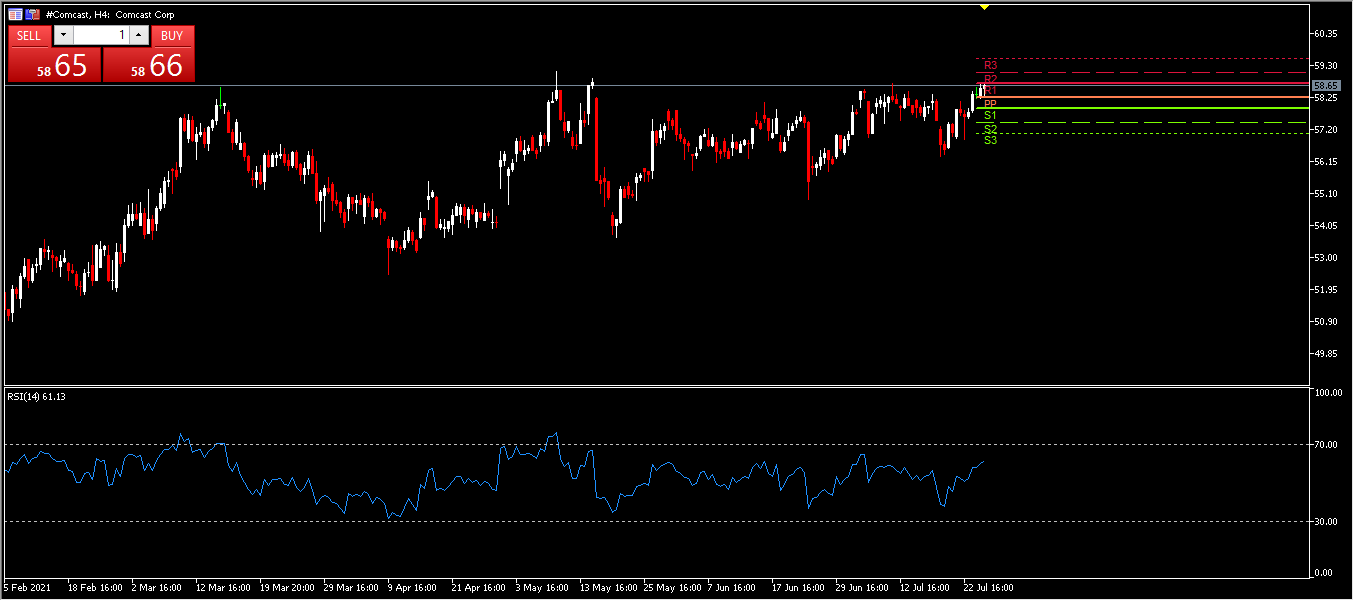
The following chart deals with the main pivots and levels of support and resistance. The main pivot appears at 58.24 and resistances at 58.71, 59.06 and 59.53, while we find support at 57.89, 57.42 and 57.07. The RSI has made more than one top near the 70 level during the second quarter of the year in May to express the excessive buying movement. The figure shows the fluctuation of the movement between ups and downs, with a rise starting from July 19 achieving a value of 61.13.
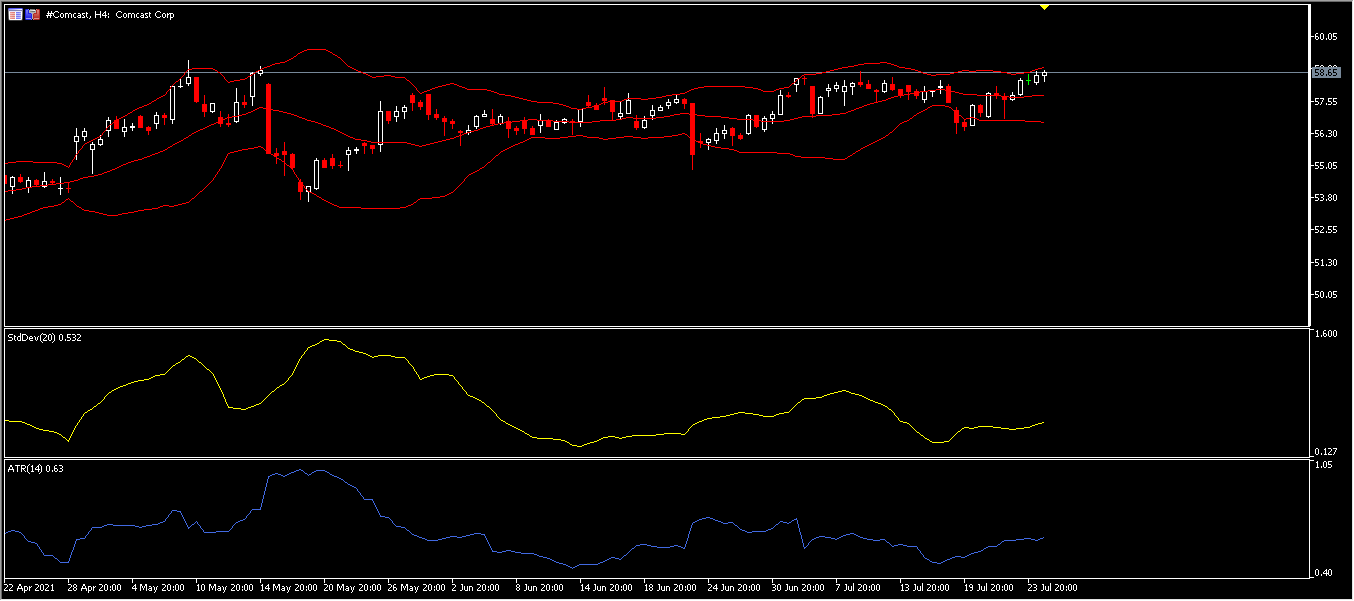
The Bollinger Bands indicator is relatively tight compared to June indicating that the price currently consolidates. The upper range of the volatility channel stops at 58.84, while the lower side comes at 56.71, and ATR is at 0.63.
Premium
You have reached your limit of 3 free articles for this month.
Start your subscription and get access to all our original articles.


