|

Pound Sterling Price News and Forecast: GBP/USD remains well within the striking distance of a multi-month low

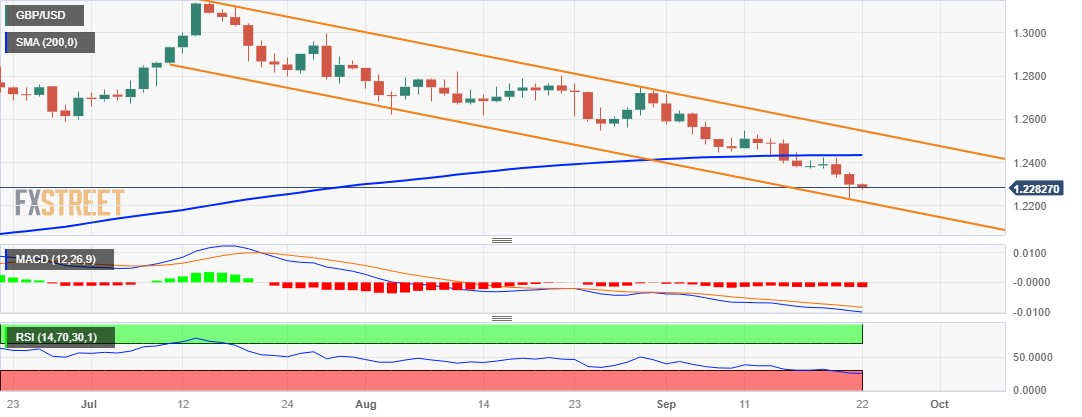
GBP/USD Price Analysis: Remains depressed below 1.2400, seems vulnerable to slide further

The GBP/USD pair struggles to capitalize on the previous day's modest recovery from the 1.2235 area, or its lowest level since late March and meets with a fresh supply during the Asian session on Friday. Spot prices currently trade near the 1.2280-1.2275 region, down for the third successive day, and seem vulnerable to decline further.

The British Pound (GBP) continues with its relative underperformance in the wake of the Bank of England's (BoE) surprise decision to leave interest rates unchanged on Thursday. In contrast, the Federal Reserve's (Fed) hawkish outlook, signalling the possibility of at least one more rate hike by the end of this year, assists the US Dollar (USD) to hold steady just below a six-month peak. This, along with a generally softer tone around the equity markets, is seen benefitting the safe-haven Greenback and exerting downward pressure on the GBP/USD pair. Read more...
fxsoriginal

GBP/USD hangs near multi-month low, seems vulnerable below 1.2400 ahead of UK/US PMIs

The GBP/USD pair struggles to capitalize on the previous day's modest bounce from the 1.2230 area or a nearly six-month low and oscillates in a narrow trading band during the Asian session on Friday. Spot prices remain below the 1.2300 round-figure mark and seem vulnerable to prolonging a well-established downtrend witnessed over the past two months or so.

The US Dollar (USD) holds steady just below its highest level since June touched on Thursday and continues to draw support from the Federal Reserve's (Fed) hawkish outlook, which, in turn, is seen acting as a headwind for the GBP/USD pair. The Fed decided to keep rates unchanged at a 22-year high, between the 5.25%-5.50% range, as was widely expected, though signalled the possibility of at least one more rate hike by the end of this year in the wake of sticky inflation. Read more...

GBP/USD

Overview
Today last price1.2286
Today Daily Change-0.0012
Today Daily Change %-0.10
Today daily open1.2298
 
Trends
Daily SMA201.2507
Daily SMA501.2683
Daily SMA1001.2647
Daily SMA2001.2434
 
Levels
Previous Daily High1.2352
Previous Daily Low1.2235
Previous Weekly High1.2548
Previous Weekly Low1.2379
Previous Monthly High1.2841
Previous Monthly Low1.2548
Daily Fibonacci 38.2%1.228
Daily Fibonacci 61.8%1.2307
Daily Pivot Point S11.2238
Daily Pivot Point S21.2179
Daily Pivot Point S31.2122
Daily Pivot Point R11.2355
Daily Pivot Point R21.2411
Daily Pivot Point R31.2471

Author

FXStreet Team

Composed of a group of economic journalists and FX experts, the FXStreet content team produces and oversees all content published on FXStreet. It provides a purely journalistic approach to the Forex market.


More from FXStreet Team
Share:

Editor's Picks

GBP/USD clings to multi-day peaks below 1.3500

GBP/USD trades with marked gains on Friday, now giving away some gains following an earlier surpass of the key 1.3500 yardstick. Indeed, Cable gathers fresh steam amid the strong offered stance in the Greenback, all after US NFP badly missed expectations in July.

EUR/USD: Post-NFP bounce falters around 1.1580

EUR/USD reverses Thursday’s decline and trades with solid gains in the 1.1560 region, or two-month peaks, on Friday. The pair’s firm performance comes in a context of a sharp correction in the US Dollar as investors continue to assess disheartening US NFP readings.

How Wall Street rigs the game [Video]

In this week’s Live from the Vault, Andrew Maguire is joined by Peter Antico and Sean Stone to discuss the Paradigm of Money - an in-depth expose of financial market corruption, from naked shorting to the two-tier system that protects Wall Street.

XRP Price Forecast: XRP nears critical $1.00 support
Ripple (XRP) remains pressured on Friday, trading around $1.03 at the time of writing. The token appears to hold this current level as support but lacks a catalyst to sustain a knee-jerk rebound toward the next key resistance at $1.10.
Is Gold about to enter its biggest bull run since 2020?
Gold has stormed back into the spotlight and its next move could leave late buyers chasing. On August 5, the yellow metal surged almost 7% – roughly $174 – to close near $4,308 an ounce, posting one of its biggest daily advances in recent history. A weaker U.S dollar, falling Treasury yields, changing Federal Reserve expectations and renewed safe-haven demand all struck at once.
9-3: Is the Federal Reserve’s vote tally Warsh's new forward guidance?
The rate did not move. Neither did the statement, and that’s the more interesting fact. Set the July 29 Federal Open Market Committee (FOMC) statement beside the one issued on June 17, and the two documents are identical apart from a single verb and a paragraph at the bottom naming three dissenters.














