GBP/USD Price Analysis: Remains depressed below 1.2300, seems vulnerable to slide further
- GBP/USD remains well within the striking distance of a multi-month low set on Thursday.
- The BoE's surprise pause undermines the GBP and acts as a headwind amid a bullish USD.
- The technical setup favours bears and supports prospects for a further depreciating move.

The GBP/USD pair struggles to capitalize on the previous day's modest recovery from the 1.2235 area, or its lowest level since late March and meets with a fresh supply during the Asian session on Friday. Spot prices currently trade near the 1.2280-1.2275 region, down for the third successive day, and seem vulnerable to decline further.
The British Pound (GBP) continues with its relative underperformance in the wake of the Bank of England's (BoE) surprise decision to leave interest rates unchanged on Thursday. In contrast, the Federal Reserve's (Fed) hawkish outlook, signalling the possibility of at least one more rate hike by the end of this year, assists the US Dollar (USD) to hold steady just below a six-month peak. This, along with a generally softer tone around the equity markets, is seen benefitting the safe-haven Greenback and exerting downward pressure on the GBP/USD pair.
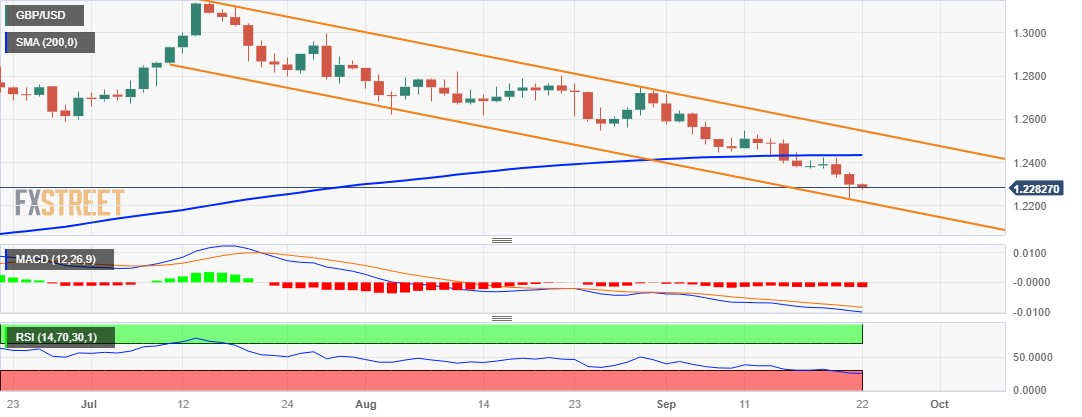
From a technical perspective, the recent steep downfall from the 1.1275 area, or a 17-month high touched in July, has been along a downward-sloping channel. This points to a well-established short-term downtrend and favours bearish traders. Furthermore, oscillators on the daily chart are holding deep in the negative territory and are still far from being in the oversold zone, validating the bearish outlook for the GBP/USD pair. Hence, a slide towards retesting the channel support, around the 1.2235-1.2230 region, looks like a distinct possibility.
Some follow-through selling will confirm a fresh bearish breakdown and drag spot prices further below the 1.2200 round figure, towards the next relevant support near the 1.2170-1.2165 zone. The GBP/USD pair could extend the downfall further towards the 1.2140-1.2135 intermediate support before eventually dropping to the 1.2100 mark.
On the flip side, any recovery above the 1.2300 round figure might now confront a stiff barrier near the overnight swing high, around the 1.2350 region. This is followed by resistance near the 1.2375 zone, which if cleared should allow the GBP/USD pair to reclaim the 1.2400 mark. Any subsequent move up, however, might still be seen as a selling opportunity and remain capped near the 200-day Simple Moving Average (SMA) support breakpoint, now turnd hurdle, near the 1.2435-1.2440 region.
GBP/USD daily chart
Technical levels to watch
Author

Haresh Menghani
FXStreet
Haresh Menghani is a detail-oriented professional with 10+ years of extensive experience in analysing the global financial markets.