Pound Sterling Price News and Forecast: GBP/USD remains under pressure near a three-month low of around 1.2390


Share:

GBP/USD Price Analysis: Remains on the defensive below the 1.2400 mark, UK inflation, Fed rate decision eyed

The GBP/USD pair remains on the defensive below the 1.2400 mark during the early Asian trading hours on Monday. The major pair currently trades near 1.2390, up 0.06% on the day. Market players prefer to wait on the sidelines ahead of the key event from this week. On Wednesday, the Federal Reserve (Fed) interest rate decision and the UK Consumer Price Index for August will be due. These events could trigger the volatility in the pair.

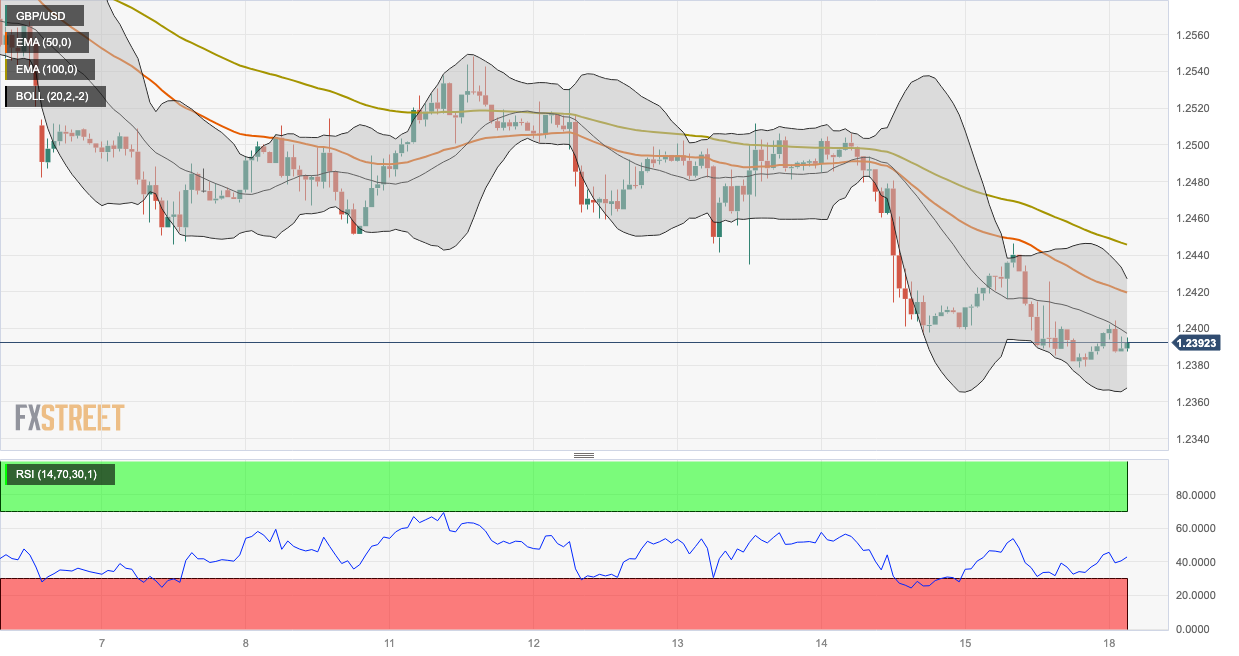
From the technical perspective, GBP/USD holds below the 50- and 100-hour Exponential Moving Averages (EMAs) with a downward slope on the one-hour chart, which means further downside looks favorable. Meanwhile, the Relative Strength Index (RSI) stands below 50, within bearish territory, suggesting that sellers are likely to retain control in the near term. Read more...

GBP/USD rebounds from multi-month low on softer USD, lacks follow-through beyond 1.2400

The GBP/USD pair attracts some buying on the first day of a new week and reverses a part of Friday's slide to the 1.2380-1.2375 area, or its lowest level since June. Spot prices currently trade around the 12400 round figure and draw some support from a softer US Dollar (USD), though any meaningful appreciating move still seems elusive.

A generally positive tone around the US equity future fails to assist the safe-haven Greenback to capitalize on its longest weekly winning streak since 2014. The USD downtick could further be attributed to some repositioning trade ahead of this week's key central bank event risk – the outcome of the highly-anticipated two-day FOMC monetary policy meeting starting on Tuesday. The Fed is scheduled to announce its decision on Wednesday and is widely expected to leave interest rates unchanged. Read more...

GBP/USD

Overview
Today last price 1.2392
Today Daily Change 0.0009
Today Daily Change % 0.07
Today daily open 1.2383
 
Trends
Daily SMA20 1.2577
Daily SMA50 1.2733
Daily SMA100 1.2654
Daily SMA200 1.2433
 
Levels
Previous Daily High 1.2446
Previous Daily Low 1.2379
Previous Weekly High 1.2548
Previous Weekly Low 1.2379
Previous Monthly High 1.2841
Previous Monthly Low 1.2548
Daily Fibonacci 38.2% 1.2405
Daily Fibonacci 61.8% 1.242
Daily Pivot Point S1 1.2359
Daily Pivot Point S2 1.2336
Daily Pivot Point S3 1.2292
Daily Pivot Point R1 1.2426
Daily Pivot Point R2 1.247
Daily Pivot Point R3 1.2494


Share: Feed news

Information on these pages contains forward-looking statements that involve risks and uncertainties. Markets and instruments profiled on this page are for informational purposes only and should not in any way come across as a recommendation to buy or sell in these assets. You should do your own thorough research before making any investment decisions. FXStreet does not in any way guarantee that this information is free from mistakes, errors, or material misstatements. It also does not guarantee that this information is of a timely nature. Investing in Open Markets involves a great deal of risk, including the loss of all or a portion of your investment, as well as emotional distress. All risks, losses and costs associated with investing, including total loss of principal, are your responsibility. The views and opinions expressed in this article are those of the authors and do not necessarily reflect the official policy or position of FXStreet nor its advertisers. The author will not be held responsible for information that is found at the end of links posted on this page.

If not otherwise explicitly mentioned in the body of the article, at the time of writing, the author has no position in any stock mentioned in this article and no business relationship with any company mentioned. The author has not received compensation for writing this article, other than from FXStreet.

FXStreet and the author do not provide personalized recommendations. The author makes no representations as to the accuracy, completeness, or suitability of this information. FXStreet and the author will not be liable for any errors, omissions or any losses, injuries or damages arising from this information and its display or use. Errors and omissions excepted.

The author and FXStreet are not registered investment advisors and nothing in this article is intended to be investment advice.

Follow us on Telegram

Stay updated of all the news

Join Telegram

Recommended content


Follow us on Telegram

Stay updated of all the news

Join Telegram

Recommended content

Editors’ Picks

EUR/USD loses traction, retreats below 1.0600

EUR/USD loses traction, retreats below 1.0600

EUR/USD lost its recovery momentum and declined below 1.0600 in the American session on Friday, erasing a portion of its daily gains in the process. Nevertheless, the risk-positive market atmosphere after PCE inflation data helps the pair limit its losses.

EUR/USD News

GBP/USD turns negative on the day below 1.2200

GBP/USD turns negative on the day below 1.2200

GBP/USD reversed its direction and slumped below 1.2200 in the American session on Friday after rising above 1.2270 earlier in the day. Position readjustments and profit-taking on the last trading day of the quarter seems to be weighing on Pound Sterling.

GBP/USD News

Gold reverses direction, drops below $1,860

Gold reverses direction, drops below $1,860

Following a steady rebound toward $1,880 on Friday, Gold price made a sharp U-turn and turned negative on the day near $1,860. Although the 10-year US T-bond yield is down more than 1%, XAU/USD struggles to find demand on the last day of Q3.

Gold News

Polkadot Price Forecast: DOT reversal seems inevitable after 92% correction from all-time high

Polkadot Price Forecast: DOT reversal seems inevitable after 92% correction from all-time high

Polkadot price, in nearly two years, has shed 92.91% from its all-time high of $55.09. The massive downswing in DOT has pushed it down to levels that were last seen in October 2020. Hence, the chances of this altcoin forming a bottom and rallying are high. 

Read more

Earnings beat triggers Nike to spike 9%

Earnings beat triggers Nike to spike 9%

Nike (NKE) stock has surged over 9% in Friday’s premarket, climbing above $98 per share, following late Thursday’s fiscal first-quarter earnings release. Nike beat pessimistic earnings expectations by more than 23% and hiked its dividend by 9%.

Read more

Forex MAJORS

Cryptocurrencies

Signatures