|

GBP/USD Price Analysis: Remains on the defensive below the 1.2400 mark, UK inflation, Fed rate decision eyed

  • GBP/USD remains under pressure near a three-month low of around 1.2390 on Monday.
  • The pair holds below the 50- and 100-hour EMAs; Relative Strength Index (RSI) stands below 50, within bearish territory.
  • The key resistance level is seen near the 1.2420-1.2430 zone; 1.2367 acts as an initial support level.

The GBP/USD pair remains on the defensive below the 1.2400 mark during the early Asian trading hours on Monday. The major pair currently trades near 1.2390, up 0.06% on the day. Market players prefer to wait on the sidelines ahead of the key event from this week. On Wednesday, the Federal Reserve (Fed) interest rate decision and the UK Consumer Price Index for August will be due. These events could trigger the volatility in the pair.

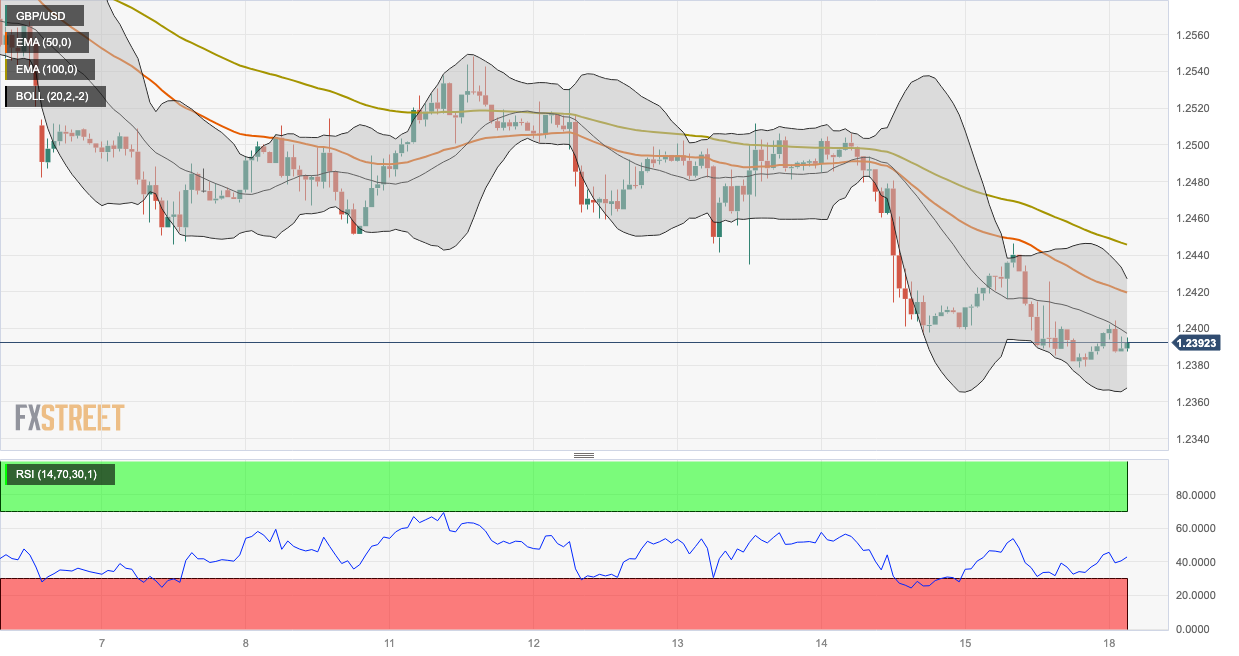
From the technical perspective, GBP/USD holds below the 50- and 100-hour Exponential Moving Averages (EMAs) with a downward slope on the one-hour chart, which means further downside looks favorable. Meanwhile, the Relative Strength Index (RSI) stands below 50, within bearish territory, suggesting that sellers are likely to retain control in the near term.

The key resistance level for GBP/USD is seen near the confluence of the upper boundary of the Bollinger Band and the 50-hour EMA at the 1.2420-1.2430 region. The additional upside filter is located at 1.2445 (the 100-hour EMA). Further north, a psychological round figure at 1.2500 will be the next barrier for the pair, followed by 1.2530 (a high of September 12).

On the downside, any follow-through selling below the lower limit of the Bollinger Band at 1.2367 will see a drop to 1.2350 (a low of May 31). The next contention for the pair emerges near a round mark and a low of May 25 at 1.2300.

GBP/USD one-hour chart

GBP/USD

Overview
Today last price1.2391
Today Daily Change0.0008
Today Daily Change %0.06
Today daily open1.2383
 
Trends
Daily SMA201.2577
Daily SMA501.2733
Daily SMA1001.2654
Daily SMA2001.2433
 
Levels
Previous Daily High1.2446
Previous Daily Low1.2379
Previous Weekly High1.2548
Previous Weekly Low1.2379
Previous Monthly High1.2841
Previous Monthly Low1.2548
Daily Fibonacci 38.2%1.2405
Daily Fibonacci 61.8%1.242
Daily Pivot Point S11.2359
Daily Pivot Point S21.2336
Daily Pivot Point S31.2292
Daily Pivot Point R11.2426
Daily Pivot Point R21.247
Daily Pivot Point R31.2494

Author

Lallalit Srijandorn

Lallalit Srijandorn is a Parisian at heart. She has lived in France since 2019 and now becomes a digital entrepreneur based in Paris and Bangkok.

More from Lallalit Srijandorn
Share:

Markets move fast. We move first.

Orange Juice Newsletter brings you expert driven insights - not headlines. Every day on your inbox.

By subscribing you agree to our Terms and conditions.

Editor's Picks

EUR/USD eyes 1.1800 barrier near two-month highs

EUR/USD extends its gains for the second consecutive day on Tuesday and approaches 1.1800. On the daily chart, technical analysis indicates a persistent bullish bias, as the pair moves upward within the ascending channel pattern. Additionally, the 14-day Relative Strength Index at 68.89 reaffirms the bullish bias.

GBP/USD climbs to 1.3500 area, renews ten-week high

GBP/USD extends its weekly rally and trades at its highest level since early October near 1.3500. The US Dollar remains under persistent bearish pressure heading into the holidays, while Pound traders largely brush off the latest interest rate cut from the Bank of England.

Gold approaches $4,500 as record-setting rally continues

Gold builds on Monday's impressive gains and advances toward $4,500, setting fresh record-highs along the way. Heightened geopolitical tensions, combined with the broad-based US Dollar (USD) weakness ahead of the Q3 GDP data, help XAU/USD preserve its bullish momentum.

Uniswap holds above $6 as traders eye UNIfication vote outcome

Uniswap price holds above $6 at the time of writing on Tuesday after closing above a key resistance zone in the previous week. Traders are focusing on the highly anticipated UNIfication proposal, which is set to conclude on Thursday, and could become a key near-term catalyst. On the technical side, momentum indicators are flashing bullish signals, hinting at an upside rally.

Ten questions that matter going into 2026

2026 may be less about a neat “base case” and more about a regime shift—the market can reprice what matters most (growth, inflation, fiscal, geopolitics, concentration). The biggest trap is false comfort: the same trades can look defensive… right up until they become crowded.

XRP steadies above $1.90 support as fund inflows and retail demand rise

Ripple (XRP) is stable above support at $1.90 at the time of writing on Monday, after several attempts to break above the $2.00 hurdle failed to materialize last week. Meanwhile, institutional interest in the cross-border remittance token has remained steady.