Pound Sterling Price News and Forecast: GBP/USD initial supports hold pullback for now

GBP/USD outlook: Initial supports hold pullback for now
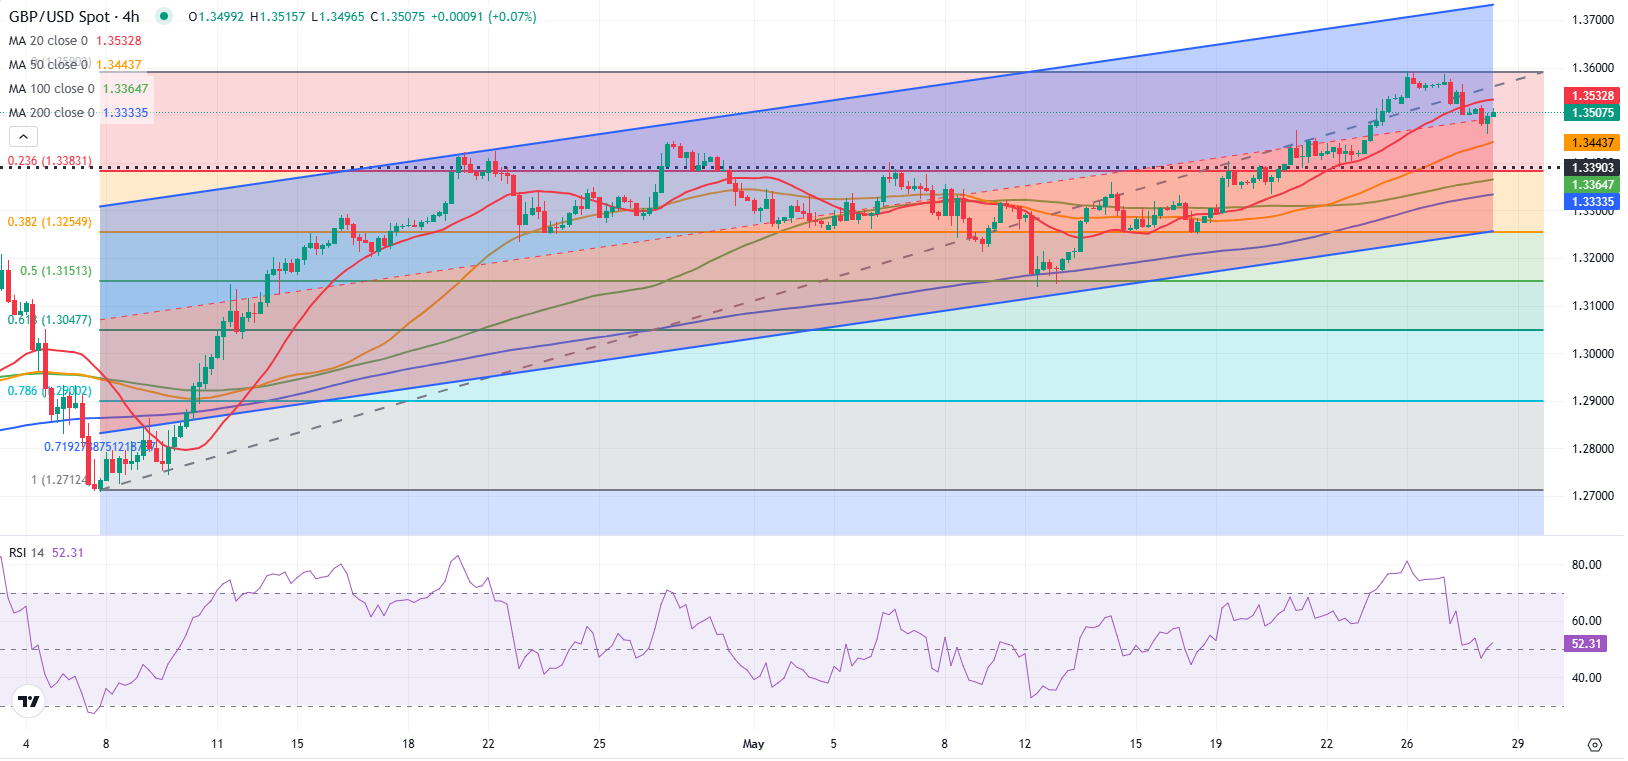
Cable remains at the back foot on Wednesday after Tuesday’s pullback from new multi-month high (1.3593) cracked psychological 1.3500 support. Price dipped to 1.3561 this morning, but quick bounce to 1.3500 zone points to headwinds that fresh bears face.
Today’s action was so far shaped in Doji candle (indecision) with short-lived probe below initial Fibo support at 1.3486 (23.6% of 1.3195/1.3593 upleg) adding to potential bear-trap formation, in scenario of very shallow pullback preceding fresh attempts to extend larger uptrend. Read more...
-1748432775893.png)
GBP/USD Forecast: Pound Sterling sellers could show interest with break below 1.3500
GBP/USD trades in a narrow channel slightly above 1.3500 on Wednesday after closing in negative territory and snapping a six-day winning streak on Tuesday. The pair's technical outlook is yet to point to a bearish reversal but sellers could take action if the pair flips 1.3500 into resistance.
The US Dollar (USD) outperformed its rivals on Tuesday and weighed on GBP/USD, supported by an improving sentiment around the US economy on the back of upbeat data releases. Read more...
The power of Elliott Wave blue boxes: GBP/USD’s perfect bounce
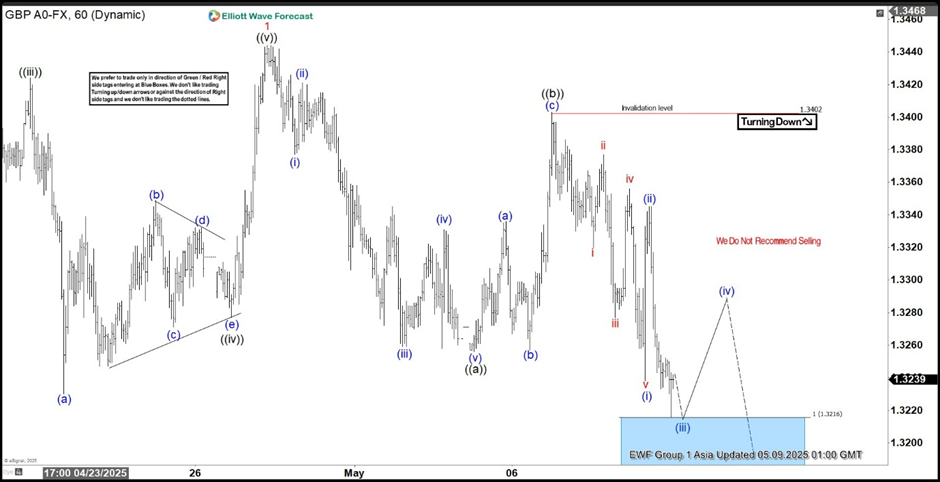
In this technical blog, we will look at the past performance of the 1-hour Elliott Wave Charts of GBPUSD. In which, the rally from 13 January 2025 low is unfolding as an impulse sequence & showed a higher high sequence therefore, called for an extension higher to take place. We knew that the structure in GBPUSD should remain supported & extend higher. So, we advised members not to sell the pair & buy the dips in 3, 7, or 11 swings at the blue box areas.
Here’s the 1-hour Elliott wave Chart from the 5.09.2025 Asia update. In which, the rally to $1.3443 high completed wave 1 & made a pullback in wave 2. The internals of that pullback unfolded as Elliott wave zigzag correction where wave ((a)) ended at $1.3257 low. Then a bounce to $1.3403 high-ended wave ((b)) & started the next leg lower in wave ((c)) towards $1.3216- $1.3100 blue box area. From there, buyers were expected to appear looking for new highs ideally or for a 3-wave bounce minimum. Read more...
Author
FXStreet Team
FXStreet
Composed of a group of economic journalists and FX experts, the FXStreet content team produces and oversees all content published on FXStreet. It provides a purely journalistic approach to the Forex market.


