|

The power of Elliott Wave blue boxes: GBP/USD’s perfect bounce

In this technical blog, we will look at the past performance of the 1-hour Elliott Wave Charts of GBPUSD. In which, the rally from 13 January 2025 low is unfolding as an impulse sequence & showed a higher high sequence therefore, called for an extension higher to take place. We knew that the structure in GBPUSD should remain supported & extend higher. So, we advised members not to sell the pair & buy the dips in 3, 7, or 11 swings at the blue box areas. We will explain the structure & forecast below:

GBP/USD one-hour Elliott Wave chart from 5.08.2025

Chart

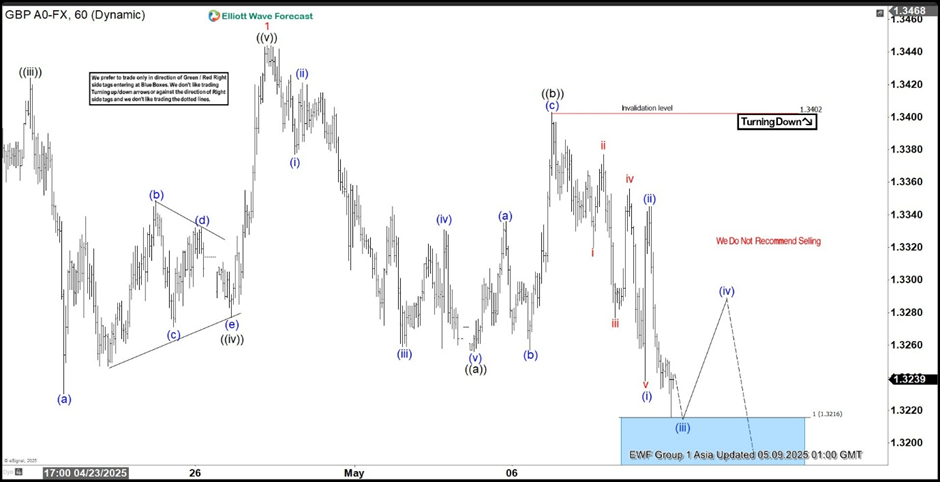
Here’s the 1-hour Elliott wave Chart from the 5.09.2025 Asia update. In which, the rally to $1.3443 high completed wave 1 & made a pullback in wave 2. The internals of that pullback unfolded as Elliott wave zigzag correction where wave ((a)) ended at $1.3257 low. Then a bounce to $1.3403 high-ended wave ((b)) & started the next leg lower in wave ((c)) towards $1.3216- $1.3100 blue box area. From there, buyers were expected to appear looking for new highs ideally or for a 3-wave bounce minimum.

GBP/USD latest one-hour Elliott Wave chart from 5.26.2025

Chart

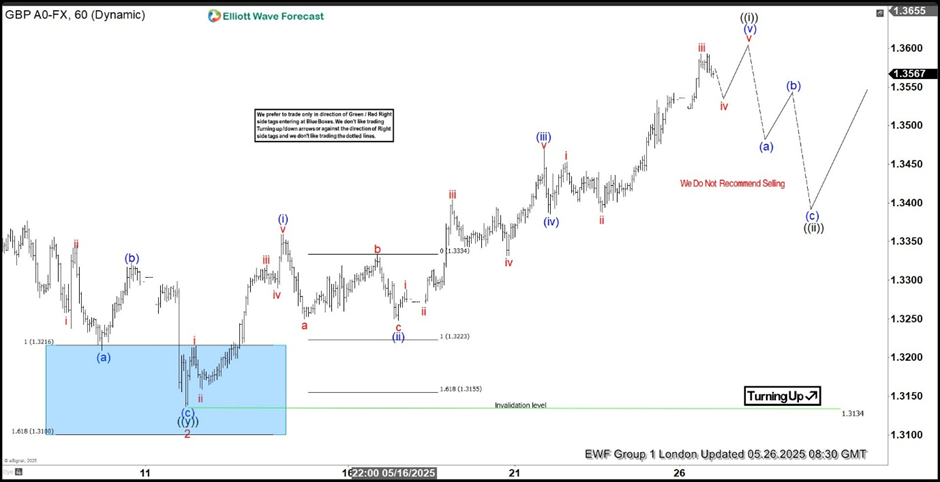
This is the latest 1-hour Elliott wave Chart from the 5.26.2025 London update. In which the pair is showing a strong reaction higher taking place, right after ending the correction within the blue box area. Allowed members to create a risk-free position shortly after taking the long position at the blue box area. Since then, the pair has already made a new high above $1.3443 high confirming the next extension higher targeting $1.3819- $1.4044 area higher.

Author

Elliott Wave Forecast Team

Elliott Wave Forecast Team

ElliottWave-Forecast.com

More from Elliott Wave Forecast Team
Share:

Editor's Picks

AUD/USD falls to near 0.7100 after slipping below 50-day EMA

AUD/USD depreciates after registering minor gains in the previous day, trading around 0.7120 during the Asian hours. The technical analysis of the daily chart shows the pair consolidating sideways within a rectangle pattern, as neither bulls nor bears gain control. The AUD/USD pair is holding a slight bearish tone however as it sits beneath both the nine-day and 50-day EMAs.

160.00: USD/JPY back near intervention territory after upbeat US jobs report

US Nonfarm Payrolls beat expectations by a wide margin in May, with 172K jobs added. The US Dollar rebounds after the release, helping USD/JPY recover from its intraday lows. Warnings from Japanese authorities continue to limit upside potential near the 160.00 threshold.

Gold targets $4,300 amid stronger Dollar

Gold faces increasing selling interest and navigates the area of three-month lows near the $4,300 mark per troy ounce on Friday. The precious metal’s decline comes as traders assess the stronger-than-expected NFP, while the bid bias in the Greenback and higher US Treasury yields also collaborate with the retracement.

Cardano hits five-year low even as Hoskinson clarifies "break" isn't an exit

Cardano (ADA) price is down 10% at press time on Friday, extending losses over 30% so far this week amid Charles Hoskinson's clarification that "break" isn't an exit.

Week ahead – Fed countdown begins amid US inflation data and geopolitical risks

Fed Chair Warsh’s first meeting approaches as key US inflation data could reshape expectations. Oil prices remain elevated as US-Iran talks continue; tariffs also return to the spotlight. ECB is expected to hike; will it be a one-off move or is July live?

The US economy defies the rules: 100 days into the Oil shock and the recession signal is still missing

More than three months after the start of the Iran war and the resulting disruption to global energy markets, the US economy continues to display remarkable resilience. The conflict has triggered a sharp rise in Oil prices, reignited inflationary pressures and fueled widespread concerns about a potential economic slowdown.