|
Pound Sterling Price News and Forecast: GBP/USD dribbles inside a bullish chart pattern

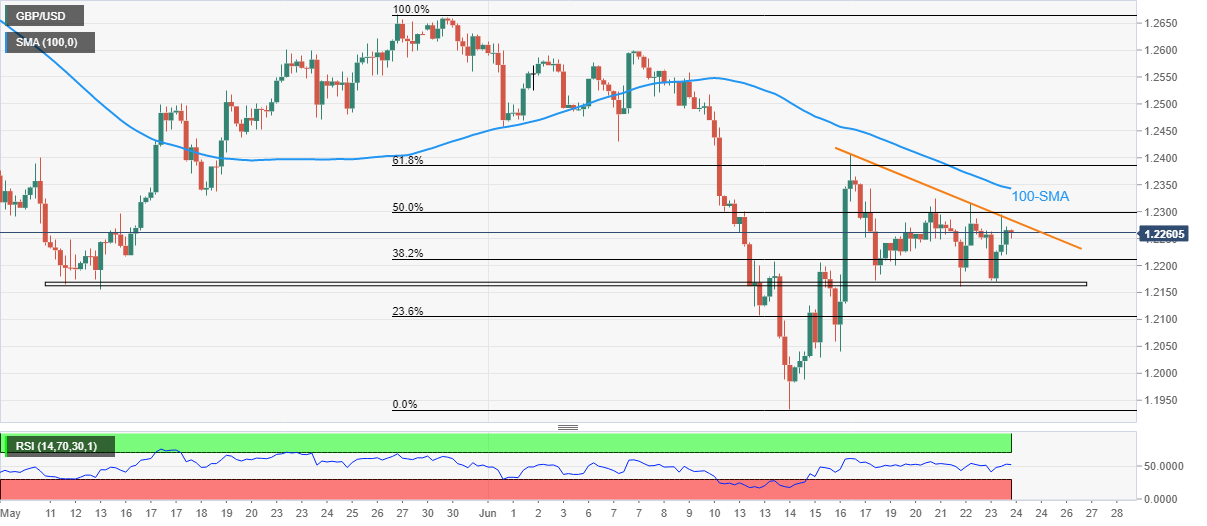
GBP/USD Price Analysis: Descending triangle keeps buyers hopeful around 1.2250
GBP/USD treads water around 1.2260 during Friday’s Asian morning, following the last two days’ dormancy inside a falling triangle bullish formation. Adding strength to the Cable pair’s upside bias is the firmer RSI and a six-week-old horizontal support area that also comprises the stated triangle’s lower line.
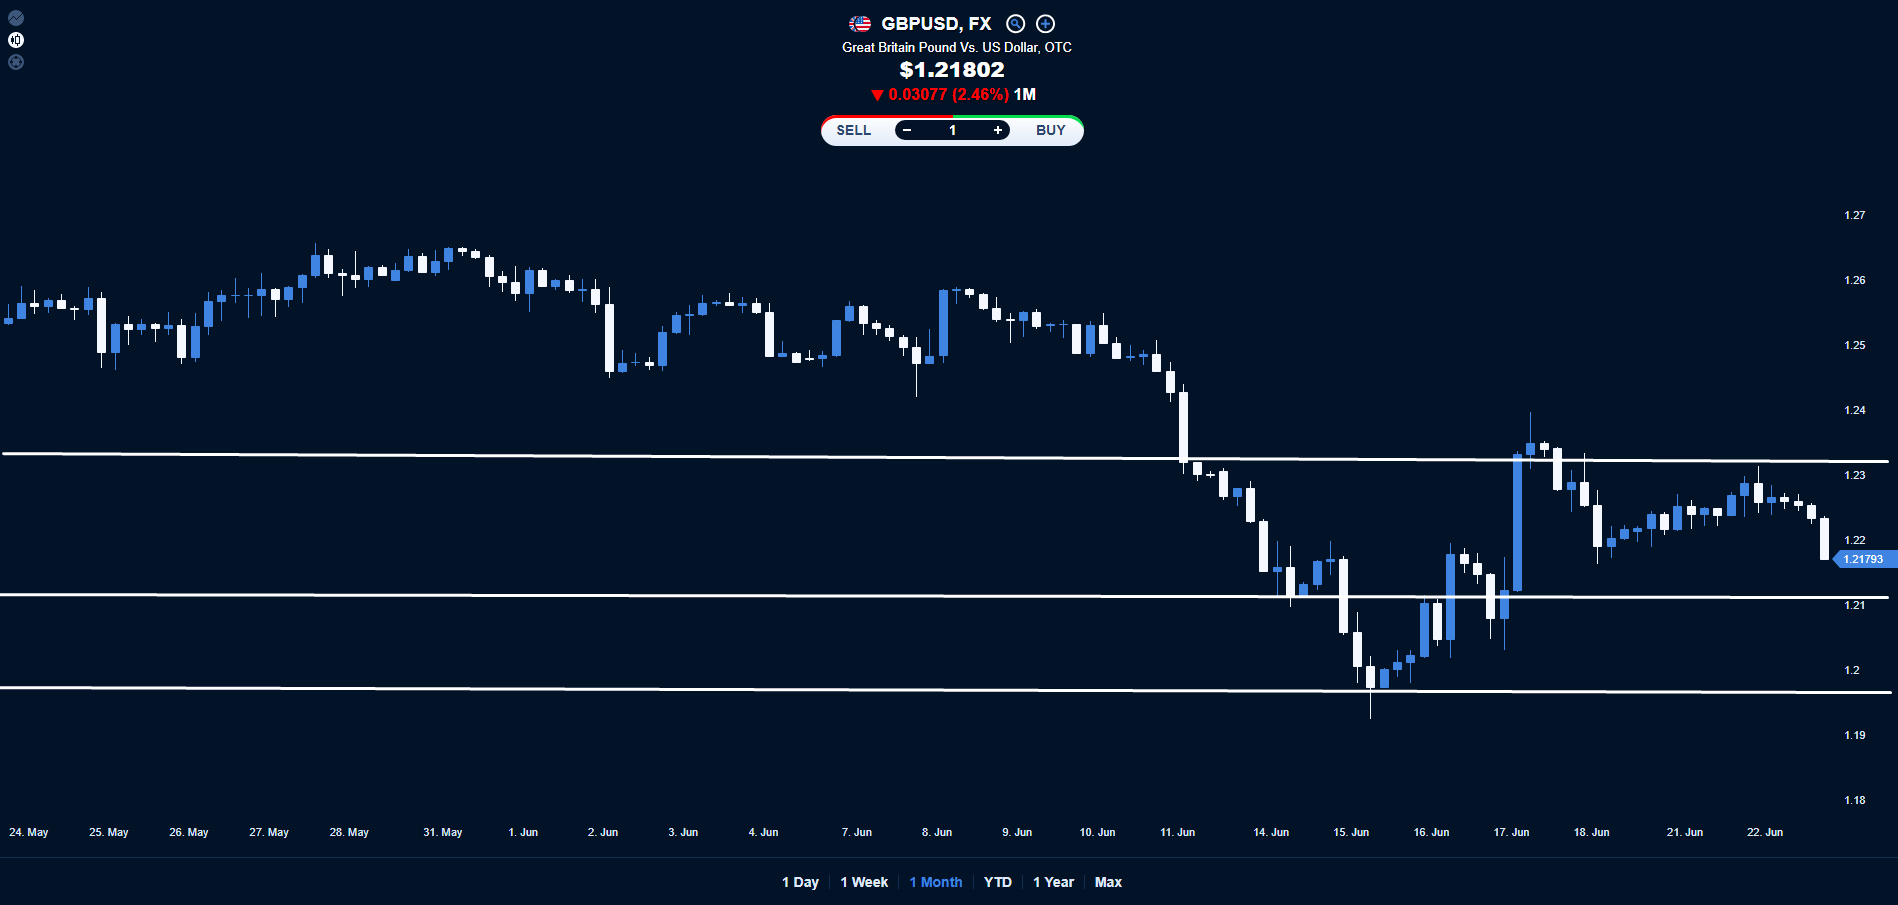
Could GBP/USD drop below 1.21?
Looking at GBPUSD Chart, we can see that after a big run from around 1.20 to 1.24, it starts dropping to the current level of 1.2180. Today we could expect it to test its support level at around 1.21 and if able to hold its rate above that level then we should expect an upward bounce otherwise it is possible to see it testing again its lowest level for the year at around 1.20.
Author

FXStreet Team
FXStreet
More from FXStreet Team


