Pan American Silver Corporation (ticker: PAAS) is engaged in the production and sale of silver, gold, zinc, lead and copper. It also has other related activities, including exploration, extraction, processing, refining and reclamation. The company operates 10 mining sites, including La Colorada, Dolores, Huaron, Morococha, San Vicente, Manantial Espejo, Shahuindo, La Arena, Timmins and Escobal. In the charts below, we look at the technical outlook of the company.

PAAS monthly Elliott Wave chart

Paas

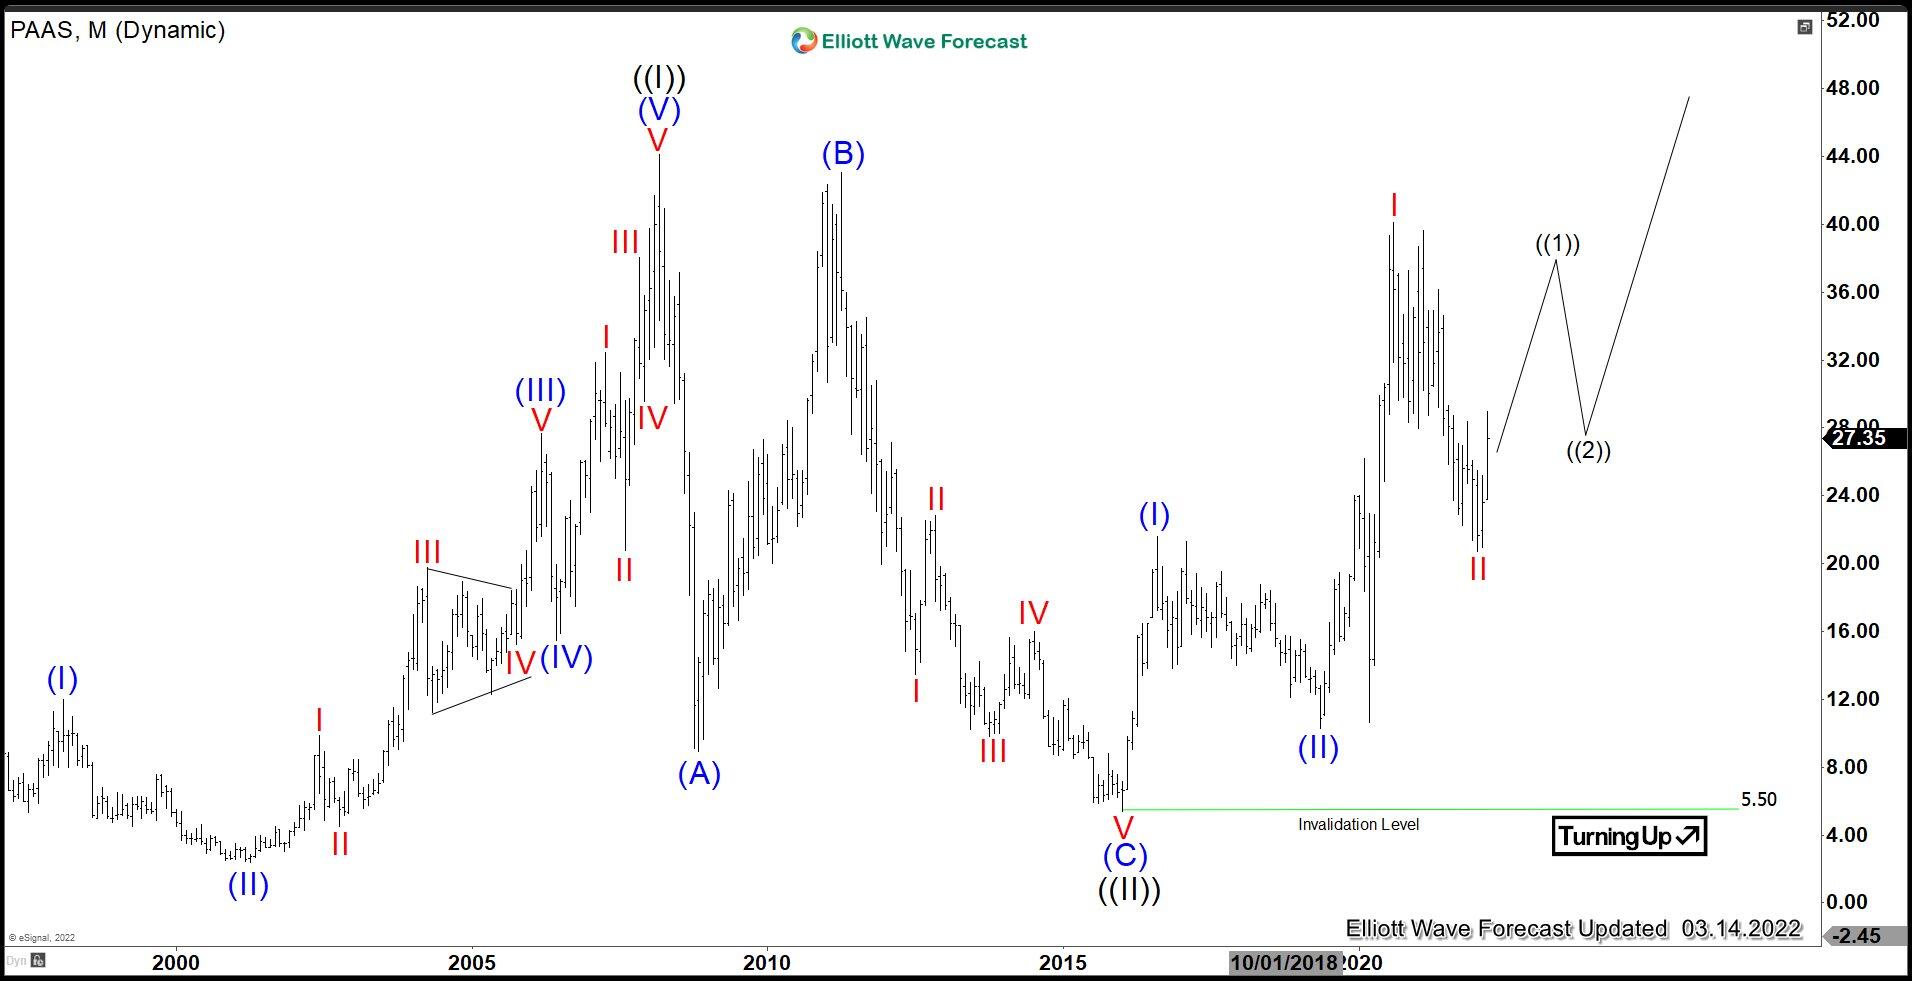
The monthly chart of PAAS above shows the rally from January 2016 low is in progress as a nesting 5 waves impulse. Up from January 2016 low, wave (I) ended at 21.59 and pullback in wave (II) ended at 10.26. The stock then extends higher in wave (III) which subdivides in another 5 waves in lesser degree. Up from wave (II), wave I ended at 40.11 and dips in wave II ended at 20.73. Expect the stock to continue higher in the months to come in wave III of (III).

PAAS daily Elliott Wave chart

Paas

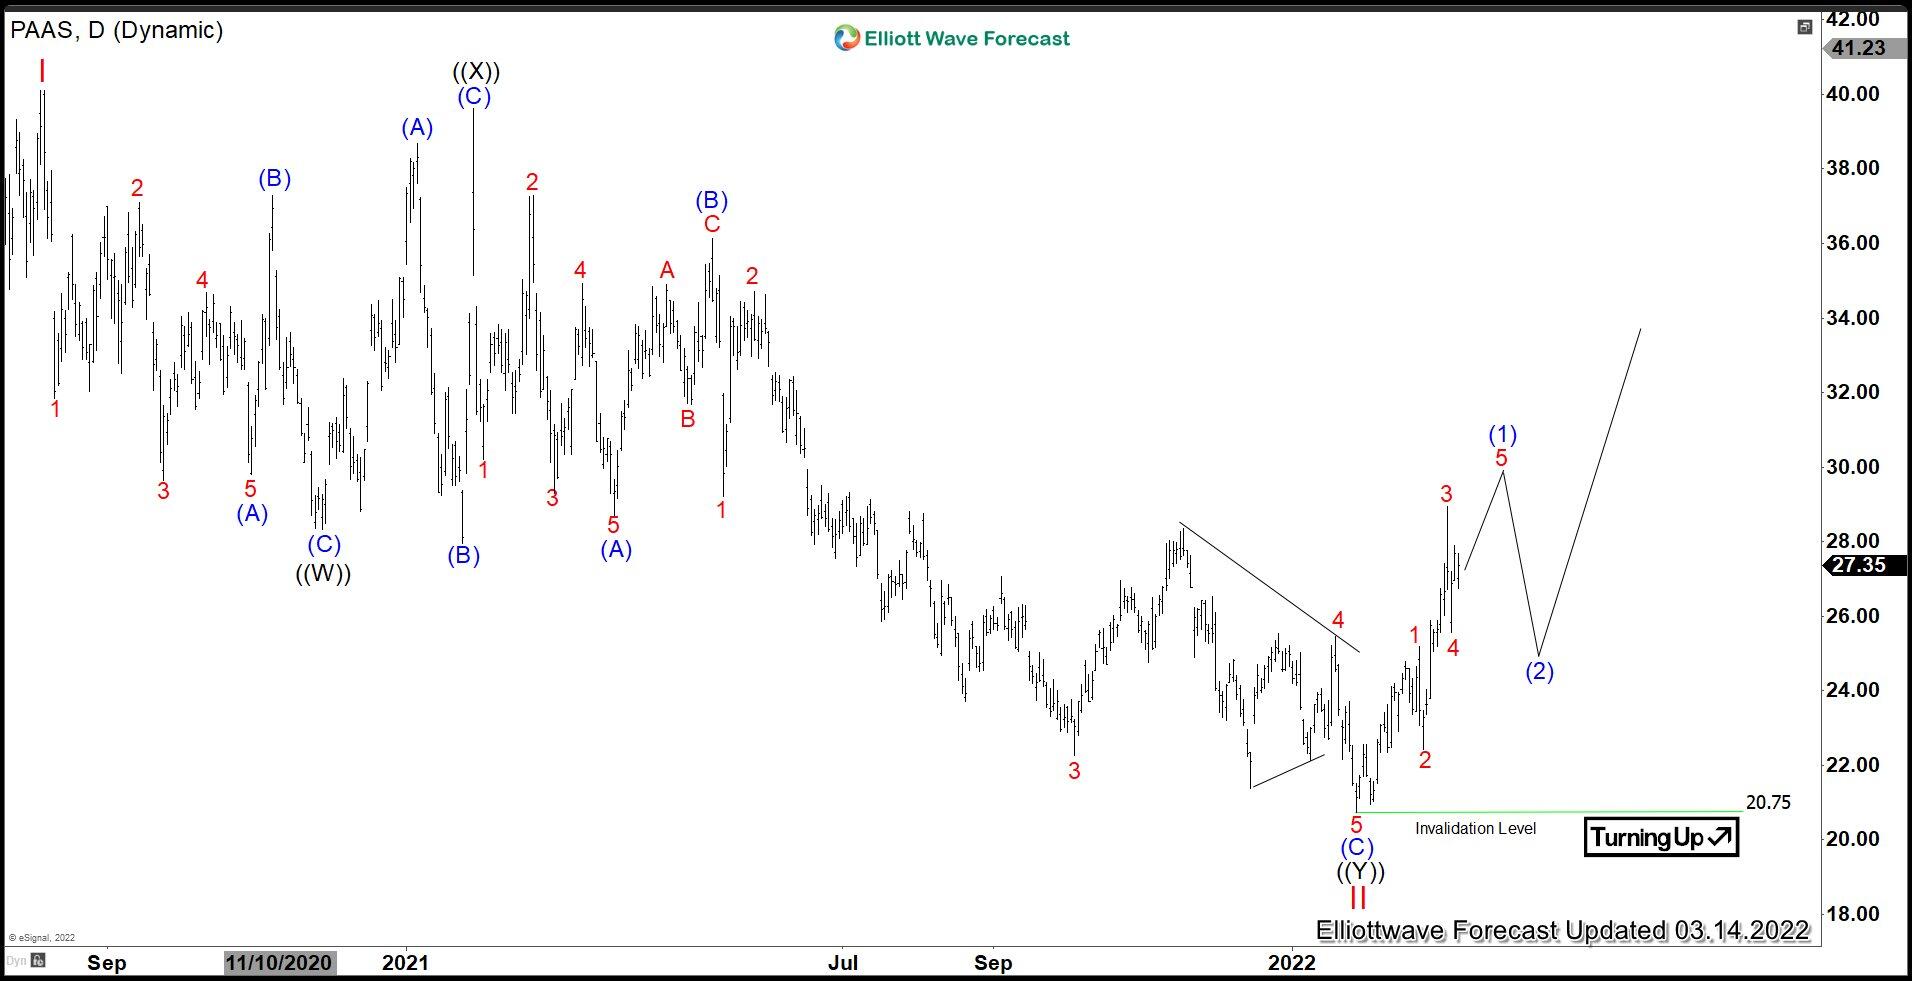
Daily Elliott Wave chart above shows the stock ended correction to cycle from May 2019 low in wave II pullback at 20.75. Structure of wave II unfolded in a double three Elliott Wave structure where wave ((W)) ended at 28.33, rally in wave ((X)) ended at 39.62, and wave ((Y)) of II completed at 20.75. While pullback stays above wave II low, expect the stock to extend higher.

PAAS 4 hour Elliott Wave chart

Paas

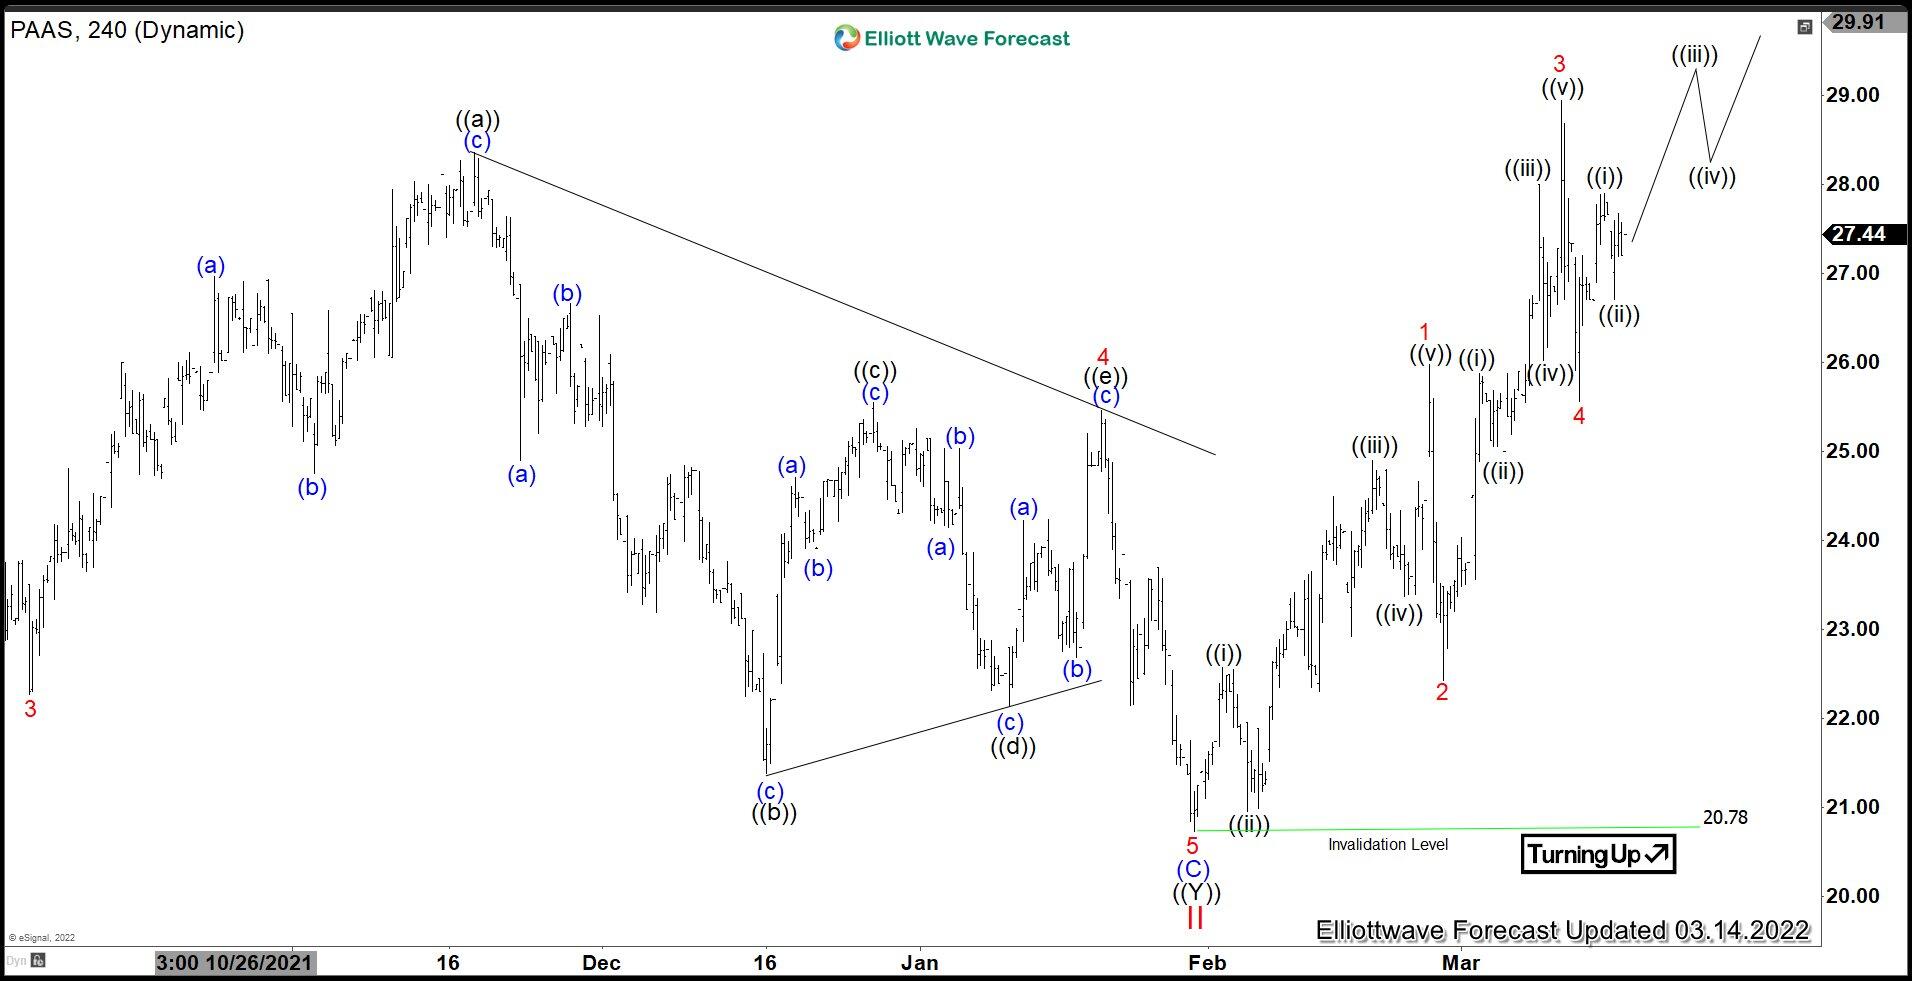
The 4 hour chart of PAAS above shows the rally from January 29, 2022 low is in progress as a 5 waves impulse Elliott Wave structure. Up from wave II, wave 1 ended at 25.98 and pullback in wave 2 ended at 22.43. Stock then extends higher in wave 3 towards 28.95, and pullback in wave 4 ended at 25.56. Expect the stock to extend higher to end wave 5 of (1), then it should pullback in larger degree 3 waves to correct cycle from January 29 low in wave (2) before the rally resumes.

Share: Feed news

FURTHER DISCLOSURES AND DISCLAIMER CONCERNING RISK, RESPONSIBILITY AND LIABILITY Trading in the Foreign Exchange market is a challenging opportunity where above average returns are available for educated and experienced investors who are willing to take above average risk. However, before deciding to participate in Foreign Exchange (FX) trading, you should carefully consider your investment objectives, level of xperience and risk appetite. Do not invest or trade capital you cannot afford to lose. EME PROCESSING AND CONSULTING, LLC, THEIR REPRESENTATIVES, AND ANYONE WORKING FOR OR WITHIN WWW.ELLIOTTWAVE- FORECAST.COM is not responsible for any loss from any form of distributed advice, signal, analysis, or content. Again, we fully DISCLOSE to the Subscriber base that the Service as a whole, the individual Parties, Representatives, or owners shall not be liable to any and all Subscribers for any losses or damages as a result of any action taken by the Subscriber from any trade idea or signal posted on the website(s) distributed through any form of social-media, email, the website, and/or any other electronic, written, verbal, or future form of communication . All analysis, trading signals, trading recommendations, all charts, communicated interpretations of the wave counts, and all content from any media form produced by www.Elliottwave-forecast.com and/or the Representatives are solely the opinions and best efforts of the respective author(s). In general Forex instruments are highly leveraged, and traders can lose some or all of their initial margin funds. All content provided by www.Elliottwave-forecast.com is expressed in good faith and is intended to help Subscribers succeed in the marketplace, but it is never guaranteed. There is no “holy grail” to trading or forecasting the market and we are wrong sometimes like everyone else. Please understand and accept the risk involved when making any trading and/or investment decision. UNDERSTAND that all the content we provide is protected through copyright of EME PROCESSING AND CONSULTING, LLC. It is illegal to disseminate in any form of communication any part or all of our proprietary information without specific authorization. UNDERSTAND that you also agree to not allow persons that are not PAID SUBSCRIBERS to view any of the content not released publicly. IF YOU ARE FOUND TO BE IN VIOLATION OF THESE RESTRICTIONS you or your firm (as the Subscriber) will be charged fully with no discount for one year subscription to our Premium Plus Plan at $1,799.88 for EACH person or firm who received any of our content illegally through the respected intermediary’s (Subscriber in violation of terms) channel(s) of communication.

Recommended content


Recommended content

Editors’ Picks

AUD/USD jumps above 0.6500 after hot Australian CPI data

AUD/USD jumps above 0.6500 after hot Australian CPI data

AUD/USD extended gains and recaptured 0.6500 in Asian trading, following the release of hotter-than-expected Australian inflation data. The Australian CPI rose 1% in QoQ in Q1 against 0.8% forecast, providing extra legs to the Australian Dollar upside. 

AUD/USD News

USD/JPY hangs near 34-year high at 154.88 as intervention risks loom

USD/JPY hangs near 34-year high at 154.88 as intervention risks loom

USD/JPY is sitting at a multi-decade high of 154.88 reached on Tuesday. Traders refrain from placing fresh bets on the pair as Japan's FX intervention risks loom. Broad US Dollar weakness also caps the upside in the major. US Durable Goods data are next on tap. 

USD/JPY News

Gold price cautious despite weaker US Dollar and falling US yields

Gold price cautious despite weaker US Dollar and falling US yields

Gold retreats modestly after failing to sustain gains despite fall in US Treasury yields, weaker US Dollar. XAU/USD struggles to capitalize following release of weaker-than-expected S&P Global PMIs, fueling speculation about potential Fed rate cuts.

Gold News

Crypto community reacts as BRICS considers launching stablecoin for international trade settlement

Crypto community reacts as BRICS considers launching stablecoin for international trade settlement

BRICS is intensifying efforts to reduce its reliance on the US dollar after plans for its stablecoin effort surfaced online on Tuesday. Most people expect the stablecoin to be backed by gold, considering BRICS nations have been accumulating large holdings of the commodity.

Read more

US versus the Eurozone: Inflation divergence causes monetary desynchronization

US versus the Eurozone: Inflation divergence causes monetary desynchronization

Historically there is a very close correlation between changes in US Treasury yields and German Bund yields. This is relevant at the current juncture, considering that the recent hawkish twist in the tone of the Fed might continue to push US long-term interest rates higher and put upward pressure on bond yields in the Eurozone.

Read more

Forex MAJORS

Cryptocurrencies

Signatures