Palo Alto Networks Stock Earnings and Forecast: PANW shows bullish reversal chart pattern after earnings beat
- PANW stock benefits from continued strong revenue growth.
- Palo Alto Networks now nearly services half of the Global 2000.
- PANW stock is showing a bullish reversal pattern on its daily chart.

Palo Alto Networks (PANW) is not letting inflation or the constant fretting about a coming recession get it down. The cybersecurity firm reported earnings that surpassed consensus expectations on both top and bottom lines on Thursday, leading to the 10.7% advance. PANW closed out the regular session at $436.37 but ended the post-session trade at $483.
Read more: Amazon (AMZN) Stock Forecast: Internet's biggest retailer likely to break $2,000, head for $1,700
Palo Alto Networks Earnings: Executing on all fronts
Palo Alto reported adjusted earnings per share (EPS) of $1.79, beating the $1.68 consensus figure for its fiscal third quarter that ended in April. Its revenue beat was a bit narrower: $1.39 billion, which beat consensus by nearly $28 million. Wall Street forecasts for the next quarter, to be reported in August, appear to remain on course for $2.30 a share on revenue of $1.54 billion.
Palo Alto has one of the most beautiful YoY revenue growth streaks among Silicon Valley's next waive of large-cap stocks. Revenue grew at 29% YoY in the quarter. Of the 20 quarters since it went public in 2017, it has missed Wall Street revenue forecasts only once. At the rate it is growing, Palo Alto will reach $10 billion in annual sales by mid-decade.
The tech company has steadily become the go-to cybersecurity platform for major multinational corporations. Over the past year it has grown its customers with $1 million-plus annual contracts by 29%, lifting this figure from 901 to 1,160. Better yet, the growth rate matches that from the previous cycle. If there is anything to worry about, maybe it is that Palo Alto Networks may run out large-scale customers one day. Over the past year it grew its share of Global 2000 companies that are customers from 41% to 48%.

Slide from PANW FQ3 2022 earnings presentation
Palo Alto Networks Stock Forecast: Chart points to bullish reversal
At $483, PANW stock has likely already surmounted the descending top trend line of its price channel that began on April 21. Of course, it needs to close above $480 in the regular session to make this a bullish signal. From here bulls need to conquer the $500 level that worked as resistance for most of mid-May.
While nearly all tech stocks are following their sector lower, PANW has the chance to turn things around. Take a look, for instance, at the Relative Strength Index (RSI). From May 9 to 19, the lower lows trend downward. This is not the case on the RSI chart however. Between those same two dates PANW made a higher low on the RSI. This is called RSI divergence and typically foreshadows a major reversal in trend. In this case, that would mean a bullish reversal.
Additionally, if Friday's session mirrors the afterhours trade, then a bullish engulfing candle would give Monday's traders a morning star candle to work with. This pattern usually signals a bullish turnaround is in the offing.
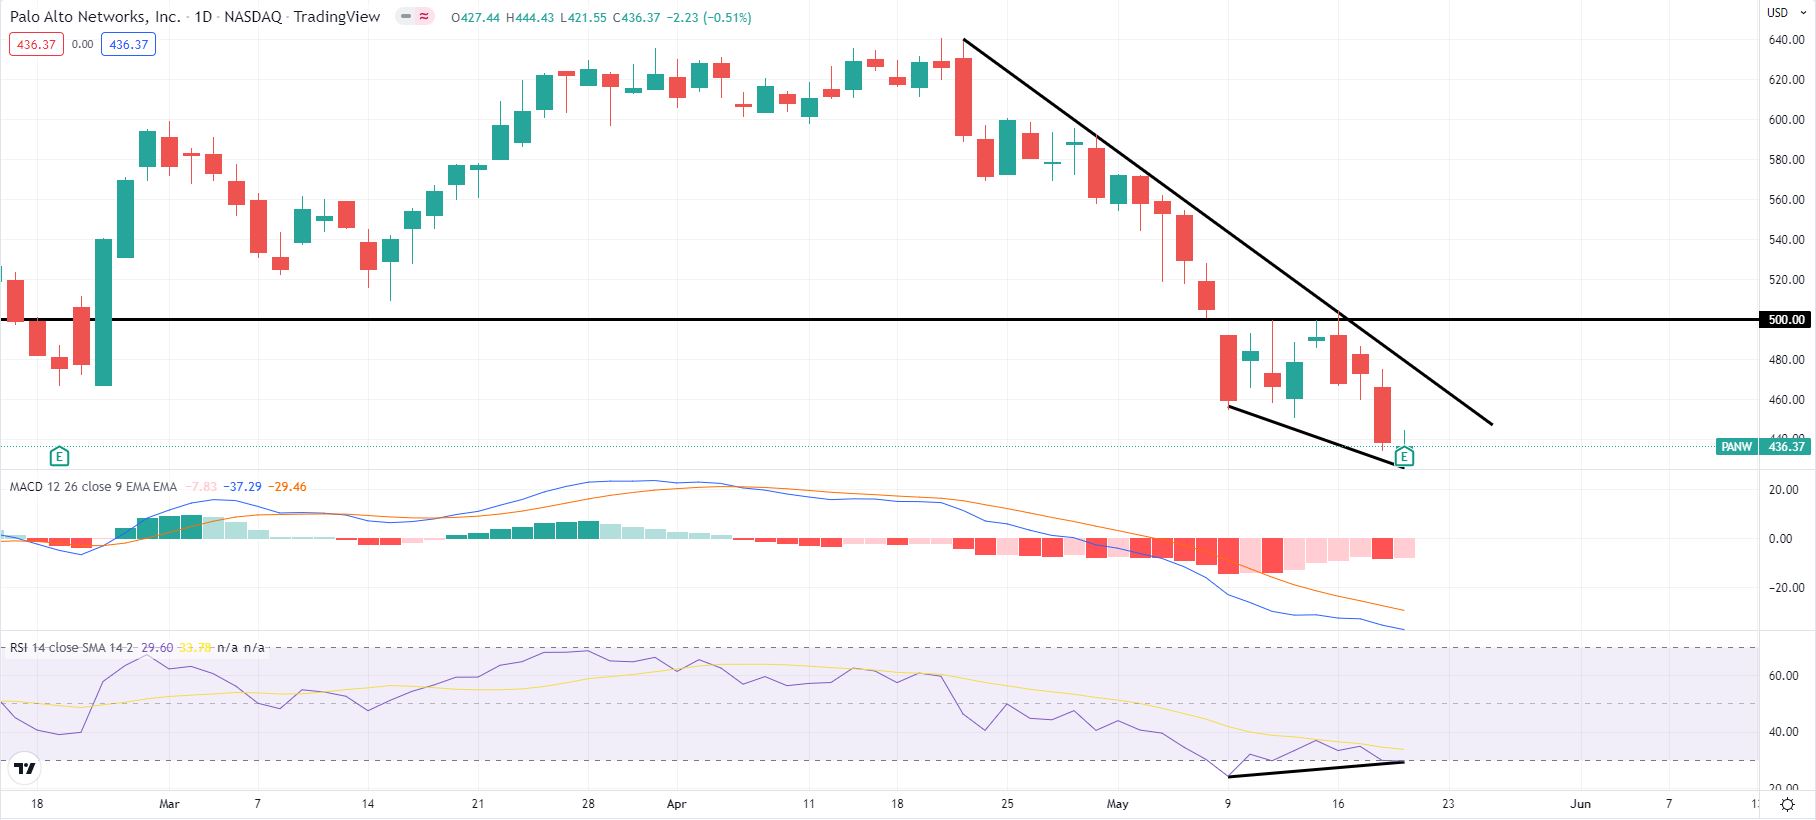
PANW daily chart
Like this article? Help us with some feedback by answering this survey:
Premium
You have reached your limit of 3 free articles for this month.
Start your subscription and get access to all our original articles.
Author

Clay Webster
FXStreet
Clay Webster grew up in the US outside Buffalo, New York and Lancaster, Pennsylvania. He began investing after college following the 2008 financial crisis.


