Palladium Price Analysis: XPD/USD struggles to extend 50-SMA breakout around $2,250
- Palladium remains sidelined after bouncing off one-week low.
- Steady RSI, SMA breakout keep buyers hopeful, five-week-old rising trend line adds to the downside filters.
Palladium (XPD/USD) treads water around $2,255 heading into Wednesday’s European session, following the previous day’s stellar rebound from the weekly bottom.
Even so, the precious metal keeps Tuesday’s upside break of the 50-SMA amid a mostly steady RSI, which in turn suggests the quote’s further advances.
That said, the latest swing high and the 200-SMA, respectively around $2,300 and $2,330, could lure the short-term buyers. However, a downward sloping trend line from April 11, close to $2,375 at the latest, will be decisive to watch during the quote’s upside past-$2,330.
Alternatively, pullback moves remain elusive until dropping back below the 50-SMA level of $2,242.
Following that, the 61.8% Fibonacci retracement level of March 29 to April 11 upside and recent low, close to $2,228 and $2,190 in that order, will test the XPD/USD bears.
Should the palladium sellers dominate past $2,190, a short-term support line from late March, around $2,150, will be crucial to watch for further directions.
Palladium: Four-hour chart
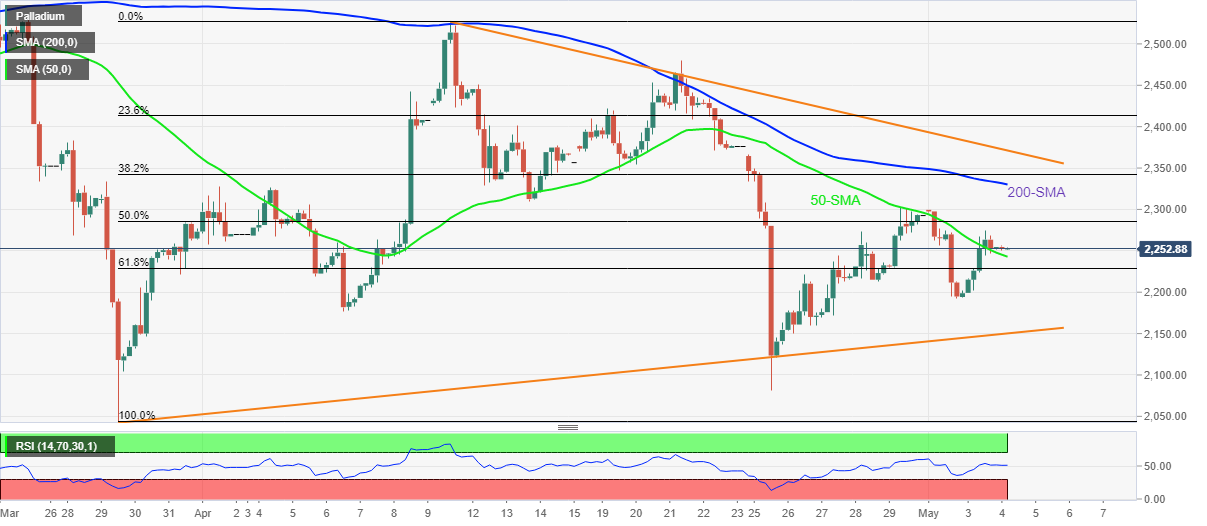
Trend: Further recovery expected
Author

Anil Panchal
FXStreet
Anil Panchal has nearly 15 years of experience in tracking financial markets. With a keen interest in macroeconomics, Anil aptly tracks global news/updates and stays well-informed about the global financial moves and their implications.


