Palladium Price Analysis: XPD/USD eyes record highs above $2800 amid a symmetrical triangle breakout
- XPD bulls focus on Tuesday’s close to confirm a symmetrical triangle breakout on 1D chart.
- RSI points north above 50.00, a test of record highs at $2882 could be in the offing.
- Deeper supply deficit issues this year propels Palladium towards 14-month highs.

Palladium (XPD/USD) is extending its winning streak into the fourth straight session, having briefly regained the $2700 mark.
The white metal is on the rise so far this year, courtesy of aggravating supply deficit issues. Russian mining giant Nornickel said last month that its nickel, copper, platinum, and palladium output could be 15-20% short of its original guidance.
The world's largest palladium producer said that on account of the mine closures in February amid water issues, it predicts platinum group metals production to fall by 710,000 ounces.
Meanwhile, expectations of faster global economic recovery from the coronavirus pandemic-induced downturn also help boost the demand for the industrial metal. Palladium is used as a critical metal in catalytic converters in gasoline-powered engines.
Price of Palladium
Looking at the technical graph, Palladium is breaking out from a two-month-long symmetrical triangle formation on the daily chart.
The price needs to close Tuesday above the falling trendline resistance at $2681. Confirmation on a daily closing basis is needed to validate the upside break.
A potential move higher towards the all-time-highs is also back by the 14-day Relative Strength Index (RSI), which edges higher above the midline but remains well beneath the overbought territory.
This suggests that there is more room to rise for the industrial metal.
Also, note that the price trades way above all the major averages on the daily time frame.
Palladium price chart: Daily
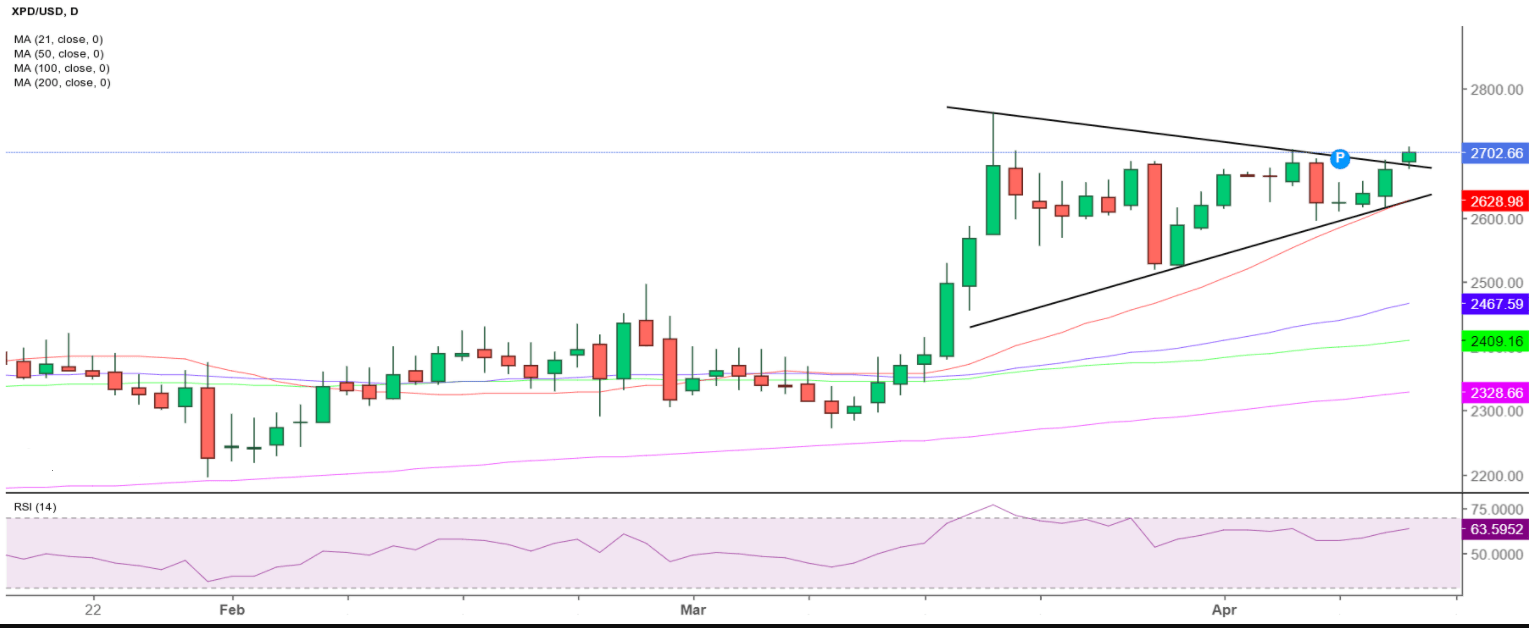
In case of any profit-taking slide, the XPD/USD pair could reverse to test the pattern resistance now support at $2681.
The confluence of the rising trendline (triangle) support and the bullish 21-daily moving average (DMA) at $2629 is likely to act as a strong downside fence for the sellers.
Author

Dhwani Mehta
FXStreet
Residing in Mumbai (India), Dhwani is a Senior Analyst and Manager of the Asian session at FXStreet. She has over 10 years of experience in analyzing and covering the global financial markets, with specialization in Forex and commodities markets.


