|

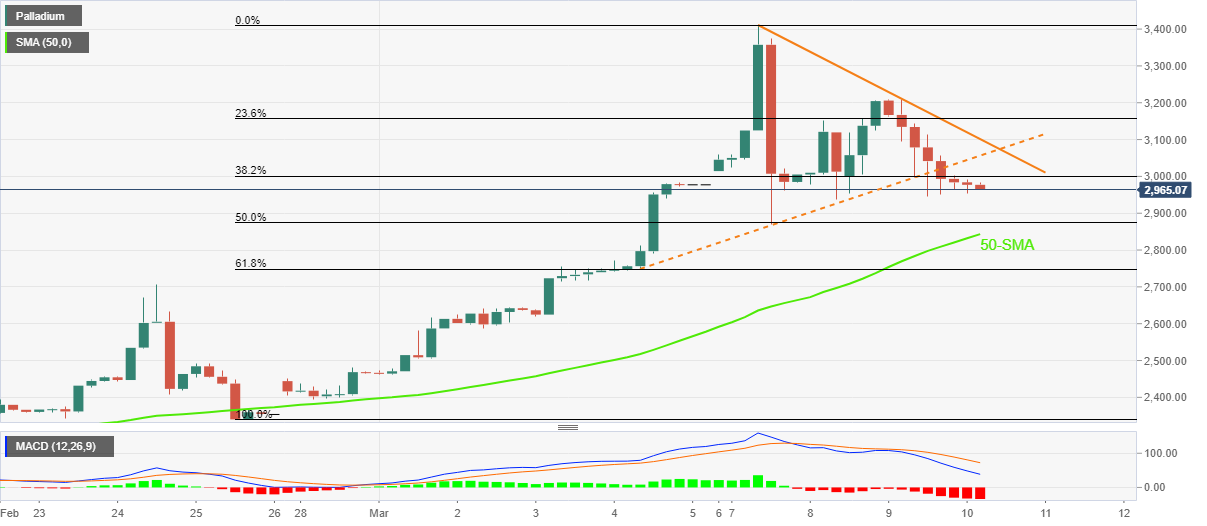
Palladium Price Analysis: XPD/USD eyes further losses below $3,000 on triangle break

  • Palladium remains pressured around intraday low after dropping the most in nine months.
  • MACD signals join bearish breakout of triangle to keep sellers hopeful.
  • Bulls need clear break above $3,210 to retake controls.

Palladium (XPD/USD) bears keep reins around $2,970, down 0.17% intraday heading into Thursday’s European session.

That said, precious metal dropped the most since June 2021 the previous day while breaking a weekly symmetrical triangle.

The triangle breakdown joins bearish MACD signals to hint at the XPD/USD pair’s further downside.

Hence, palladium sellers eye a 50-SMA level of $2,843 as immediate support ahead of targeting the 610.8% Fibonacci retracement of February-March upside, near $2,747.

On the contrary, the $3,000 threshold will initially challenge the XPD/USD rebound before highlighting the triangle’s support line of $3,055.

Following that, the stated triangle’s upper line and Wednesday’s swing top, respectively around $3,101 and $3,210, will act as the last defenses for the palladium bears.

Palladium: Four-hour chart
Trend: Further weakness expected

Additional important levels

Overview
Today last price2963.87
Today Daily Change-10.03
Today Daily Change %-0.34%
Today daily open2973.9
 
Trends
Daily SMA202570.54
Daily SMA502331.07
Daily SMA1002097.64
Daily SMA2002162.22
 
Levels
Previous Daily High3209.2
Previous Daily Low2944.34
Previous Weekly High2983.17
Previous Weekly Low2393.38
Previous Monthly High2706.5
Previous Monthly Low2193.25
Daily Fibonacci 38.2%3045.52
Daily Fibonacci 61.8%3108.02
Daily Pivot Point S12875.76
Daily Pivot Point S22777.62
Daily Pivot Point S32610.9
Daily Pivot Point R13140.62
Daily Pivot Point R23307.34
Daily Pivot Point R33405.48

Author

Anil Panchal

Anil Panchal

FXStreet

Anil Panchal has nearly 15 years of experience in tracking financial markets. With a keen interest in macroeconomics, Anil aptly tracks global news/updates and stays well-informed about the global financial moves and their implications.


More from Anil Panchal
Share:

Editor's Picks

AUD/USD remains depressed near 0.6950 after RBA minutes

AUD/USD attracts follow-through selling during Tuesday’s Asian session, looking to extend the overnight rejection slide from 0.7000, or a two-week top, following the release of RBA meeting Minutes. The US Dollar retains a bullish undertone near its highest level since April 2025 as energy-driven inflation risks keep December Fed rate hike bets firmly on the table. Adding to this, geopolitical risks further underpin the safe-haven USD.

USD/JPY extends retreat below 158.50 as intervention risks loom

USD/JPY is dropping below 158.50 in the Asian session on Tuesday, snapping a two-day winning streak and pulling back from an over two-week top touched the previous day, despite Japan's soft PPI inflation print. Bulls turn cautious amid speculation that authorities will step in to prop up the Japanese Yen, which, in turn, weighs on the pair.

Gold bulls seem hesitant below $4,200 as hawkish Fed offset USD weakness

Gold retains a mildly positive bias though it remains capped below the $4,200 mark and the top boundary of a two-week-old trading range. The US Dollar retreats from its highest level since April 2025 amid some profit-taking, offering support to the precious metal. However, the US Federal Reserve's hawkish stance and escalating Middle East conflicts could limit deeper losses for the safe-haven buck, keeping a lid on the commodity and warranting some caution for aggressive bulls.

Solana reclaims 50-day EMA amid tokenization expansion

Solana (SOL) trades above $107 on Tuesday, reclaiming the 50-day EMA after closing below it the previous day. Meanwhile, Solana’s tokenization expansion and the upcoming listing of Hong Kong’s second spot Solana Exchange Traded Fund highlight growing institutional interest.

Dollar corrects as markets watch bank earnings
The US Dollar remains broadly strong but is now correcting, with a possible retest of the breakout zone around 102 on the Dollar Index. Equity markets are showing a mixed picture: the S&P 500 and Nasdaq are weaker, while blue-chip indices such as the Dow Jones and DAX are moving higher.
Has Bitcoin really escaped the macro forces it was built to fight?
Over 17 years ago, Satoshi Nakamoto designed Bitcoin (BTC) on the back of a global financial crisis as an alternative to the global monetary system outside the control of central banks, governments and traditional intermediaries. This raises a key question: has Bitcoin really become independent of the macroeconomic forces it was built to challenge?















