Palladium Price Analysis: XPD/USD advances towards $2,050 inside nearby triangle
- Palladium prices stay on the front foot towards weekly high.
- Clear break of three-week-old descending trend line, 100-SMA favor buyers.
- Fortnight-old symmetrical triangle limits short-term moves amid firmer RSI.
Palladium (XPD/USD) takes the bids to refresh intraday high around $2,020 heading into Friday’s European session.
In doing so, the precious metal justifies the previous day’s upside break of a downward sloping trend line from May 05, as well as the 100-SMA. However, a two-week-long symmetrical triangle restricts the immediate moves of the quote.
That said, firmer RSI conditions join the aforementioned breakout to direct the current upside towards the stated triangle’s resistance line, near $2,050 by the press time.
Should the quote manage to cross the $2,045 hurdle, the $2,100 hurdle may act as an intermediate halt during the rise towards the 200-SMA level near $2,150.
Meanwhile, pullback moves may initially rest around the 100-SMA level near the $2,000 threshold before challenging the $1,980 key support comprising the aforementioned triangle’s support line and the previous resistance line.
Overall, XPD/USD is up for further advances but needs validation from the $2,045 hurdle.
Palladium: Four-hour chart
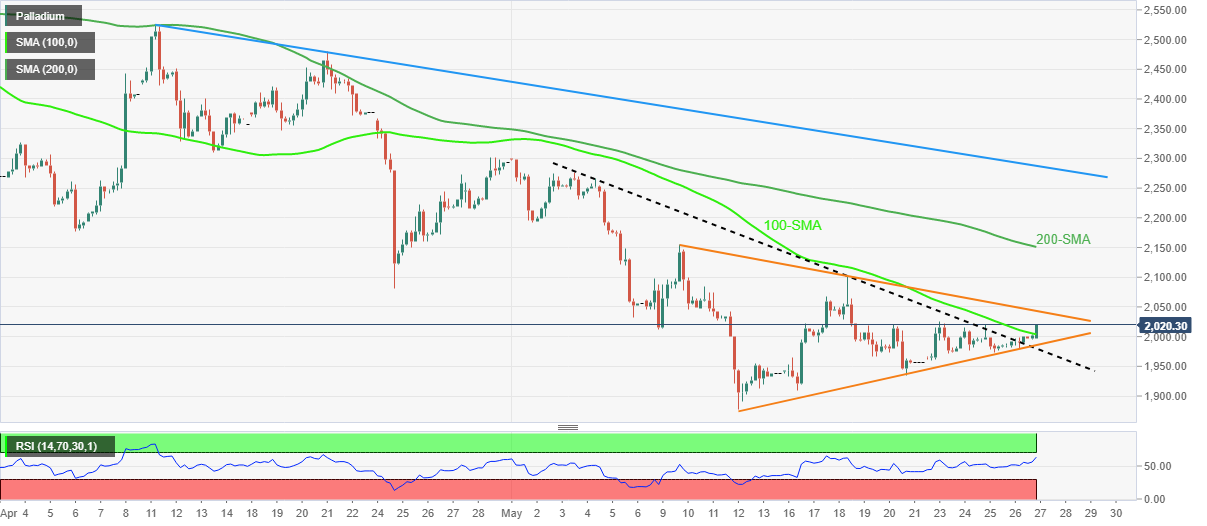
Trend: Further upside expected
Author

Anil Panchal
FXStreet
Anil Panchal has nearly 15 years of experience in tracking financial markets. With a keen interest in macroeconomics, Anil aptly tracks global news/updates and stays well-informed about the global financial moves and their implications.


