|

Celsius (CELH) up 15% on earnings: Where this surge pulls back

Celsius delivered an earnings surprise with red on the bottom line but green on revenue, and the stock is responding with about a 15% surge in pre-market trading before the bell.

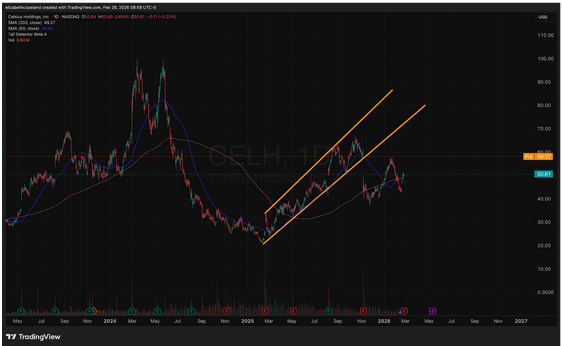
This type of move creates immediate interest for traders watching where resistance might emerge if the momentum continues into regular trading hours. There are two trendlines that define potential resistance zones: one connecting previous pivot highs and another connecting previous pivot lows. Both could act as barriers if the move up for CELH continues.
Chart

The first level to watch is the $70 even number, which carries dual significance as both a psychological level and a spot where it lines up with the trendline connecting previous pivot lows. Psychological levels like round numbers tend to attract selling pressure, and when you combine that with a technical trendline that's connecting prior lows (which now acts as resistance after being broken), you get a zone that's likely to produce at least some pullback or consolidation.

Beyond that initial resistance, the next level sits about $20 higher around $90, which aligns with the trendline connecting previous pivot highs. This upper trendline has defined the ceiling of price action, and if CELH can push through the $70 resistance and maintain momentum over the next few days, the $90 area becomes the next logical target where sellers are likely to emerge. Both areas will provide zones where pullbacks are expected, especially if we see a continued move up with strong momentum. The $70 level is particularly important because it's the first test and will determine whether this earnings pop has the strength to continue or if it's a one-day event that fades into resistance.

Author

Elizabeth Copeland

Elizabeth Copeland

Verified Investing

Elizabeth is a trader and financial journalist who uses her sharp analytical skills to spot market shifts early and trade with precision.


More from Elizabeth Copeland
Share:

Editor's Picks

AUD/USD remains below 0.7000 amid light trading

AUD/USD fills a modest bearish gap on Monday, but remains below 0.7000 in the Asian session amid holiday-thinned liquidity. The US Dollar attempts a bounce even as US bond yields pull back from multi-year highs, limiting the pair. Moreover, diminishing odds of another RBA rate hike in November cap the Aussie.

USD/JPY hovers above 158.00 amid Japan/ US holiday

USD/JPY extends its range-bound price action into a new week, trading above 158.00 as bulls remain on high alert amid speculation that authorities will step in to prop up the Japanese Yen. Meanwhile, softer US bond yields keep US Dollar bulls on the back foot and cap the pair's upside. However, geopolitical uncertainties could limit losses for the safe-haven buck amid thin liquidity due to a holiday in Japan and the US.

Gold sticks to modest losses; seems vulnerable below $4,200 on Fed hike bets

Gold extends its intraday retracement slide from a one-week high, hitting a fresh daily low around $4,170 during the early European session. The US Dollar attracts fresh buyers after a modest downtick amid the US Federal Reserve's hawkish outlook, which, in turn, is seen as weighing on the non-yielding bullion.

Pi Network Price Forecast: PI defends $0.0800 support as selling pressure mounts

Pi Network is trading in the red on Monday, hovering above $0.0800 as selling pressure mounts. PI token’s speculative demand is easing, with Open Interest below $9 million despite rising social chatter, hinting at panic-driven buzz among investors. The technical outlook for PI suggests a bearish bias, with the risk of breaking below the $0.0800 support level.

USD/INR: Deep in red below 96.00 as RBI rescues Indian Rupee

After opening significantly higher against the US Dollar (USD) on Monday, the Indian Rupee (INR) clings to recovery gains near 95.80. The pair remains undermined by the Reserve Bank of India’s (RBI) fresh measures to curb US Dollar demand, which has brought relief for the Indian currency.

Has Bitcoin really escaped the macro forces it was built to fight?
Over 17 years ago, Satoshi Nakamoto designed Bitcoin (BTC) on the back of a global financial crisis as an alternative to the global monetary system outside the control of central banks, governments and traditional intermediaries. This raises a key question: has Bitcoin really become independent of the macroeconomic forces it was built to challenge?















