Palantir ($PLTR) may have ended a bearish cycle since 2021
Palantir Technologies (PLTR), Inc. is a holding company, which engages in the development of data integration and software solutions. It operates through the Commercial and Government segments. The Commercial segment offers services to clients in the private sector. The Government segment provides solutions to the United States (US) federal government and non- US governments. The firm offers automotive, financial compliance, legal intelligence, mergers and acquisitions solutions.
In January 2021, Palantir made an important peak at 45.00 and it has been going down ever since. We could see 5 waves clearly from the top and we labeled as wave “a” ending at 17.09, more than 50% in losses. After that, PLTR bounce in 3 waves above of 38.2% Fibonacci retracement of wave “a” and resume to the downside. This correction ended at 29.29 dollars and we labeled as wave “b”. The next structure lower as wave “c” has ended with 5 swings lower to complete a zig zag correction from January 2021 peak as wave (II). This wave “c” ended at 5.97 and bounce. (If you want to learn more about Elliott Wave Theory, please follow these links: Elliott Wave Education and Elliott Wave Theory).
Palantir ($PLTR) daily chart April 03 2023
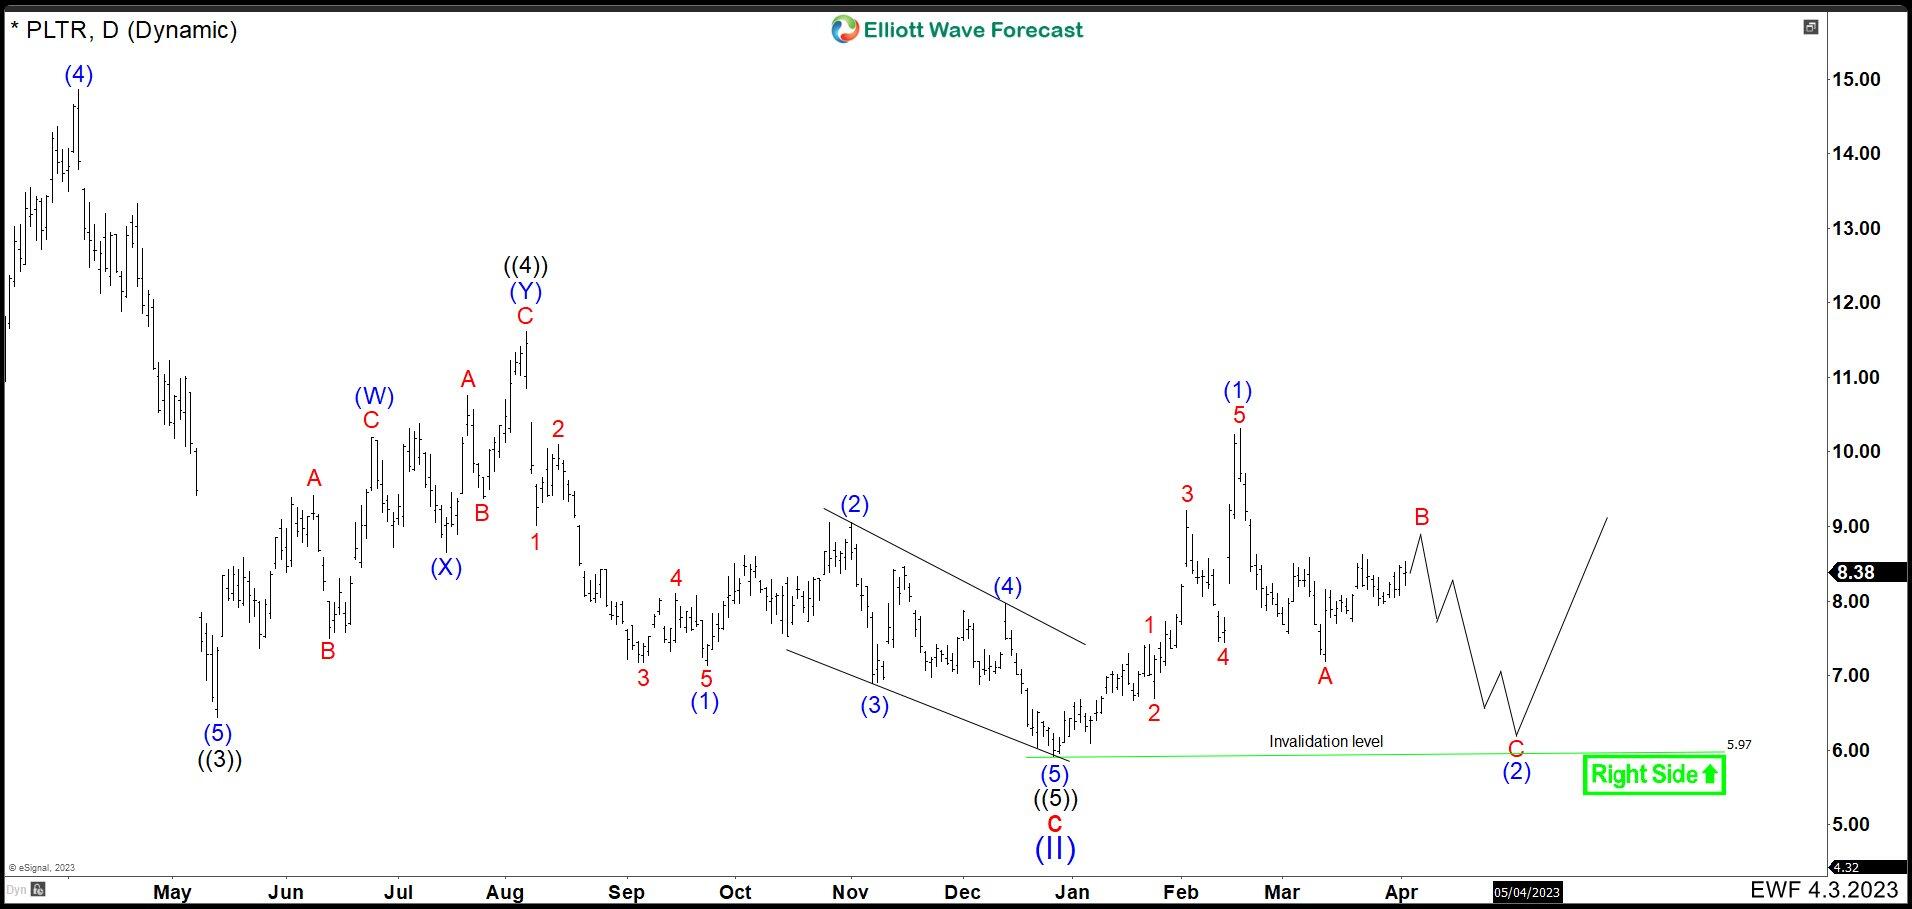
In the chart above, we can see how wave ((3)) of “c” ended at 6.44. A bounce took a part doing a double correction structure (W), (X) and (Y), ending wave ((4)) at 11.63. PLTR continued lower building a structure and we labeled as a ending diagonal to complete wave ((5)) of c of (II) at 5.97. As the structure from 11.63 high is not clear, this also could be a wave (B) of a flat correction for wave ((4)). Inclusive the whole move to 5.97 could be a wave (1) of a bigger ending diagonal as wave ((5)). Either way, we will know that if market breaks below 5.97. PLTR jump from 5.97 developing 5 swings higher and we labeled as a impulse wave (1) at 10.31. Then market dropped in 3 swings and we called wave A of (2) at 7.18. We are expecting that the stock price continue higher to complete wave B before resuming lower. The last swing lower as wave C of (2) must end above 5.97 to validate the count. A break below 5.97, we will consider that wave ((4)) was a flat correction or we are in ending diagonal as wave ((5)). This means that PALANTIR should continue sideways to lower until completing the bearish cycle and start a new rally.
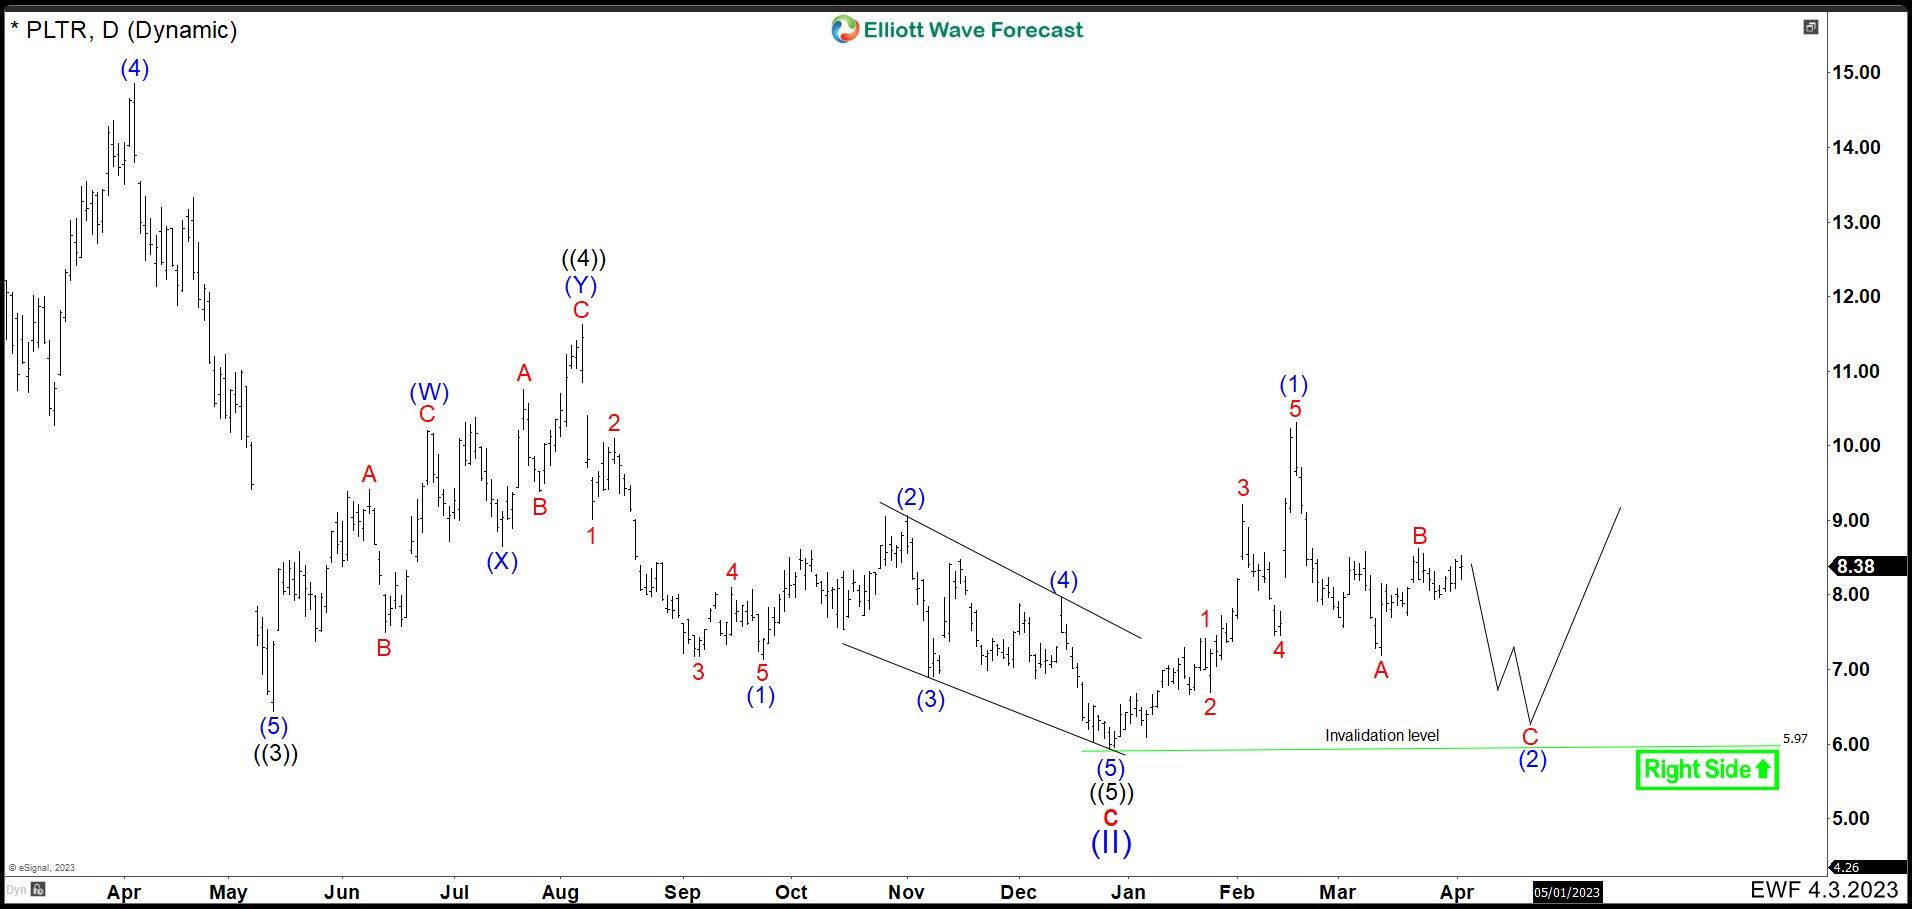
Palantir ($PLTR) daily chart April 03 2023 alternative
Premium
You have reached your limit of 3 free articles for this month.
Start your subscription and get access to all our original articles.
Author

Elliott Wave Forecast Team
ElliottWave-Forecast.com


