Oz Minerals is an Australian mining company. The main products are gold and copper.  Formed in 2008 after the merger of Oxiana Limited and Zinifex, it is based in Adelaide, Australia. One can trade it under the ticker $OZL at ASE.

Since 2020, we see a strong rally in all metals. Therefore, one should expect mining companies to profit substantially from the rising prices of the underlying assets. Indeed, we see Oz Minerals turning higher from 2013 lows. Without any doubt, the rising gold prices since 2015 have supported the $OZL stock. Then, from 2020 lows, a strong push higher in Copper has provided an additional effect to the company stock. Now, we expect more upside in both gold and copper. Therefore, Oz Minerals should remain profitable for both investors and traders as it offers a considerable upside in the next future.

In the original article from September 2021, we have expected a short term-pullback and more upside. As a matter of fact, the cycle from March 2020 has not ended yet at that time. Now, we see the cycle ended. In the current blog, we discuss the short-term pullback providing a medium-term buying opportunity.

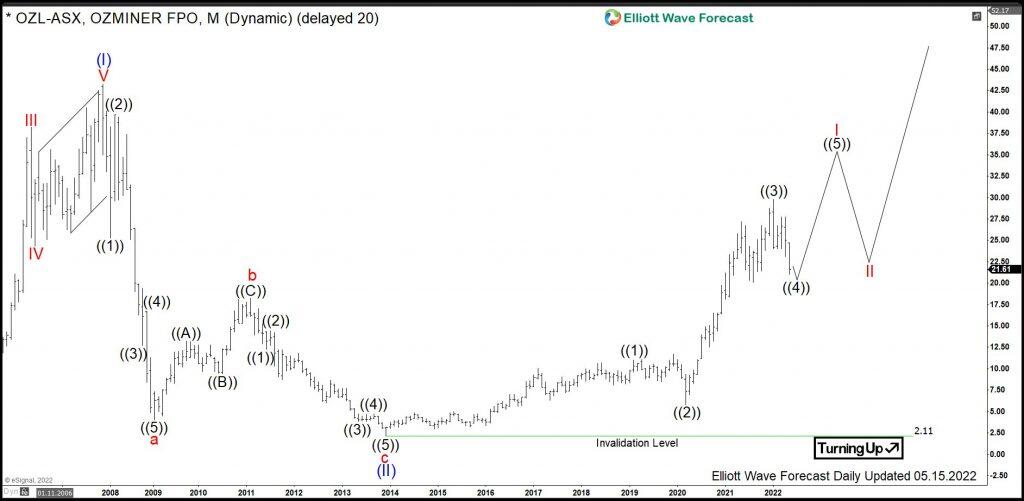
Oz Minerals monthly Elliott Wave analysis 05.15.2022

The monthly chart below shows the Oz Minerals stock $OZL at ASE. From the all-time lows, the stock price has developed a cycle higher in wave (I) of a super cycle degree. Hereby, $OZL has printed the all-time high on November 2007 at 43.20.  From the 2007 highs, a correction lower has unfolded as a zigzag correction in the blue wave (II). It has ended correcting the previous super cycle by printing an important bottom in December 2013 at 2.11.

From the 2013 lows at 2.11, a new cycle in wave (III) has already started. Clear break above 43.20 highs would confirm that. Right now, the wave (III) might be within a red wave I. Hereby, initial nest comprising waves ((1)) and ((2)) of red wave I has been formed. It has ended on March 2020. From the March 2020 lows, waves ((3))-((4))-((5)) should accomplish the wave I. Then, one should expect a pullback in red wave II and an acceleration higher in red wave III of the blue wave (III). The target for the wave ((III)) will be 45.14-71.79 area and possibly higher.

Oz

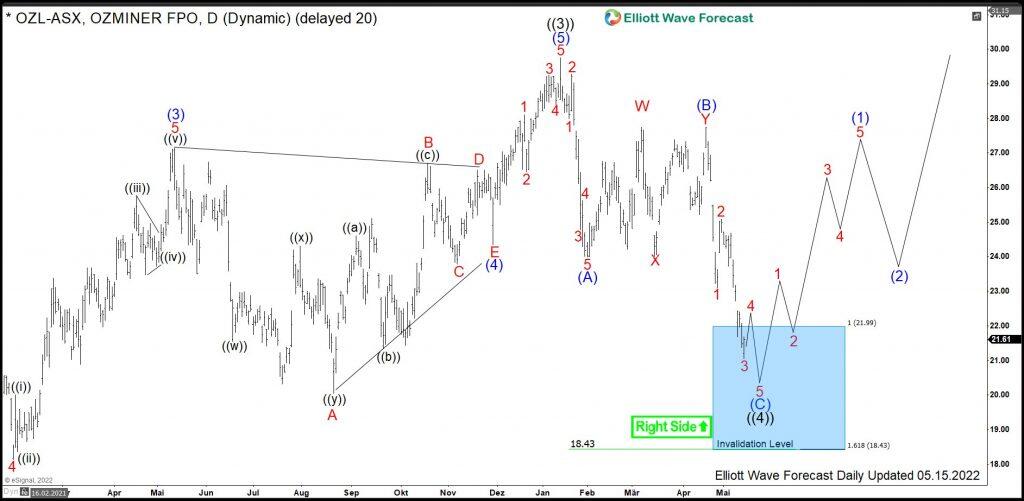
Oz Minerals daily Elliott Wave analysis 05.15.2022

The daily view demonstrates the final stages of the advance from the March 2020 lows in black wave ((3)) and the pullback in wave ((4)). From the 5.83 lows in March 2020, an impulse in black wave ((3)) has ended in January 2021 at 29.75. From the highs, pullback in wave ((4)) is currently unfolding as an Elliott wave zizag pattern and should find support above 5.83 lows. First, wave (A) has ended in February 2022 at 24. Then, a connector in wave (B) has printed a lower high in April 2022 at 27.75. From there, blue wave (C) might be still in progress. It has reached the extension area lower, but may still see more downside.

Investors and traders can be looking to buy $OZL from 21.99-18.43 area. There, a rally to new highs in wave ((5)) or a bounce in 3 waves as minimum should be expected. The target for wave ((5)) will be 31.79-35.12 area and even beyond.

Oz

Share: Feed news

FURTHER DISCLOSURES AND DISCLAIMER CONCERNING RISK, RESPONSIBILITY AND LIABILITY Trading in the Foreign Exchange market is a challenging opportunity where above average returns are available for educated and experienced investors who are willing to take above average risk. However, before deciding to participate in Foreign Exchange (FX) trading, you should carefully consider your investment objectives, level of xperience and risk appetite. Do not invest or trade capital you cannot afford to lose. EME PROCESSING AND CONSULTING, LLC, THEIR REPRESENTATIVES, AND ANYONE WORKING FOR OR WITHIN WWW.ELLIOTTWAVE- FORECAST.COM is not responsible for any loss from any form of distributed advice, signal, analysis, or content. Again, we fully DISCLOSE to the Subscriber base that the Service as a whole, the individual Parties, Representatives, or owners shall not be liable to any and all Subscribers for any losses or damages as a result of any action taken by the Subscriber from any trade idea or signal posted on the website(s) distributed through any form of social-media, email, the website, and/or any other electronic, written, verbal, or future form of communication . All analysis, trading signals, trading recommendations, all charts, communicated interpretations of the wave counts, and all content from any media form produced by www.Elliottwave-forecast.com and/or the Representatives are solely the opinions and best efforts of the respective author(s). In general Forex instruments are highly leveraged, and traders can lose some or all of their initial margin funds. All content provided by www.Elliottwave-forecast.com is expressed in good faith and is intended to help Subscribers succeed in the marketplace, but it is never guaranteed. There is no “holy grail” to trading or forecasting the market and we are wrong sometimes like everyone else. Please understand and accept the risk involved when making any trading and/or investment decision. UNDERSTAND that all the content we provide is protected through copyright of EME PROCESSING AND CONSULTING, LLC. It is illegal to disseminate in any form of communication any part or all of our proprietary information without specific authorization. UNDERSTAND that you also agree to not allow persons that are not PAID SUBSCRIBERS to view any of the content not released publicly. IF YOU ARE FOUND TO BE IN VIOLATION OF THESE RESTRICTIONS you or your firm (as the Subscriber) will be charged fully with no discount for one year subscription to our Premium Plus Plan at $1,799.88 for EACH person or firm who received any of our content illegally through the respected intermediary’s (Subscriber in violation of terms) channel(s) of communication.

Recommended content


Recommended content

Editors’ Picks

EUR/USD clings to daily gains above 1.0650

EUR/USD clings to daily gains above 1.0650

EUR/USD gained traction and turned positive on the day above 1.0650. The improvement seen in risk mood following the earlier flight to safety weighs on the US Dollar ahead of the weekend and helps the pair push higher.

EUR/USD News

GBP/USD recovers toward 1.2450 after UK Retail Sales data

GBP/USD recovers toward 1.2450 after UK Retail Sales data

GBP/USD reversed its direction and advanced to the 1.2450 area after touching a fresh multi-month low below 1.2400 in the Asian session. The positive shift seen in risk mood on easing fears over a deepening Iran-Israel conflict supports the pair.

GBP/USD News

Gold holds steady at around $2,380 following earlier spike

Gold holds steady at around $2,380 following earlier spike

Gold stabilized near $2,380 after spiking above $2,400 with the immediate reaction to reports of Israel striking Iran. Meanwhile, the pullback seen in the US Treasury bond yields helps XAU/USD hold its ground.

Gold News

Bitcoin Weekly Forecast: BTC post-halving rally could be partially priced in Premium

Bitcoin Weekly Forecast: BTC post-halving rally could be partially priced in

Bitcoin price shows no signs of directional bias while it holds above  $60,000. The fourth BTC halving is partially priced in, according to Deutsche Bank’s research. 

Read more

Week ahead – US GDP and BoJ decision on top of next week’s agenda

Week ahead – US GDP and BoJ decision on top of next week’s agenda

US GDP, core PCE and PMIs the next tests for the Dollar. Investors await BoJ for guidance about next rate hike. EU and UK PMIs, as well as Australian CPIs also on tap.

Read more

Forex MAJORS

Cryptocurrencies

Signatures