|

Oil Technical Analysis: WTI dipping below 52.00 a barrel
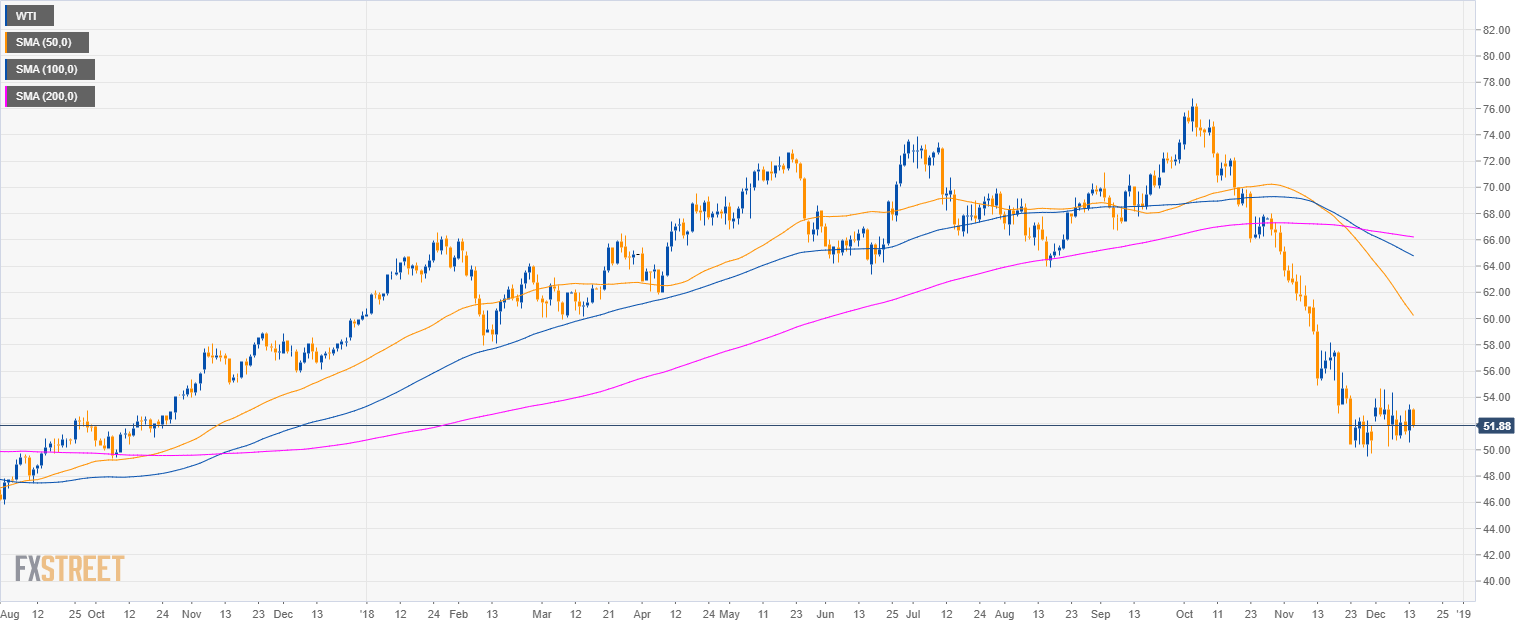
Oil daily chart

  • Crude oil WTI is trading in a bear trend below the 50, 100 and 200-day simple moving average.
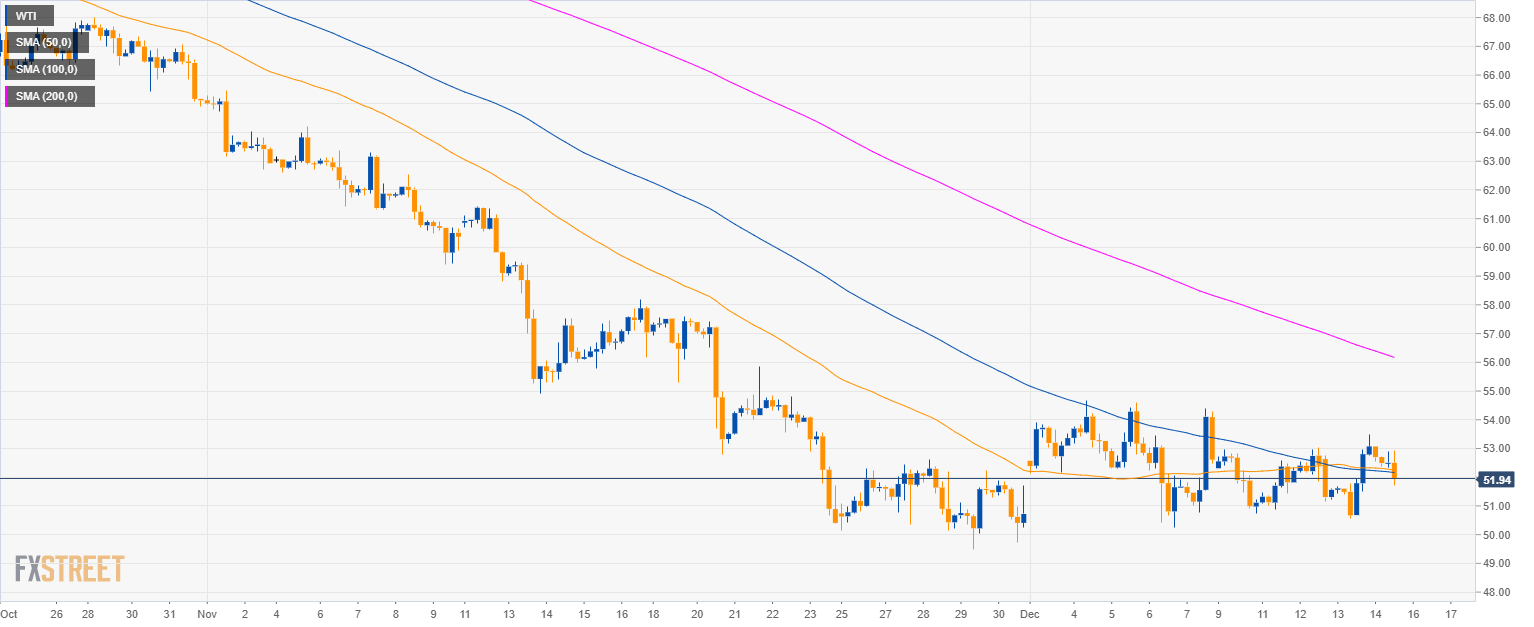
Oil 4-hour chart

  • Oil is in consolidation mode near the 50 and 100 SMA. 
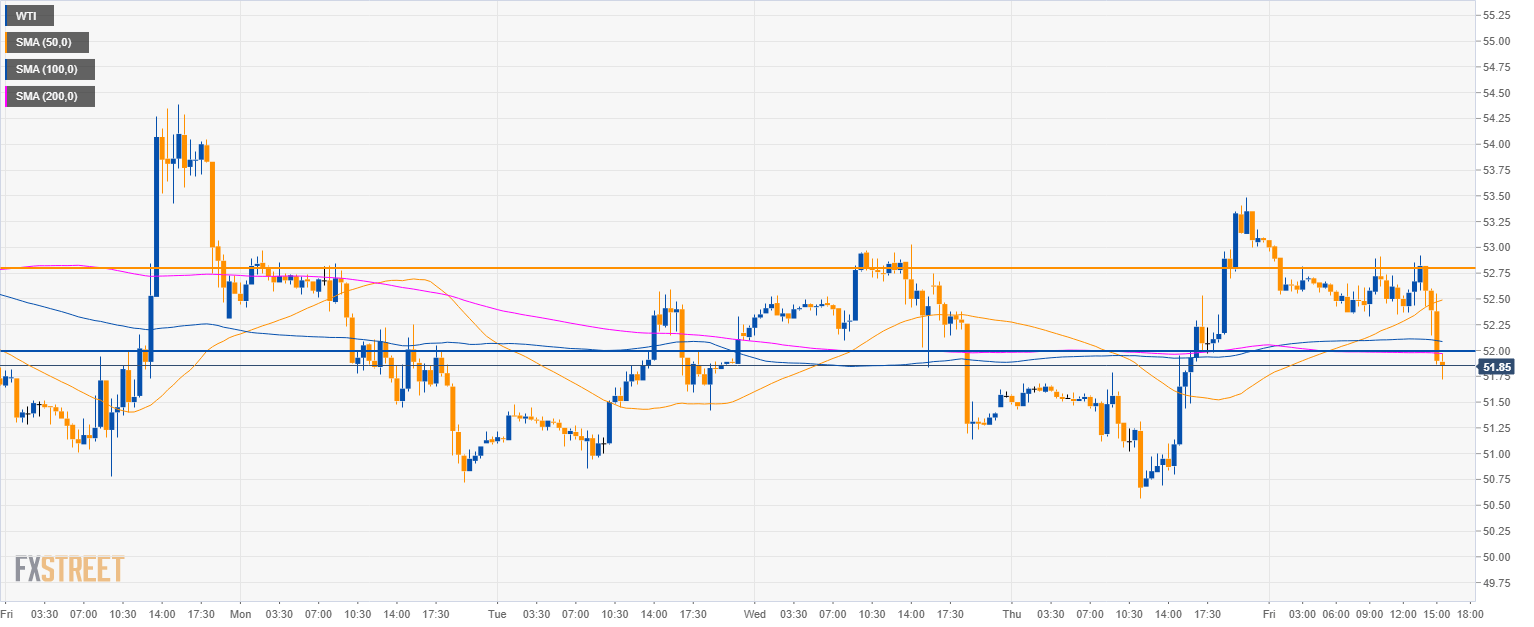
Oil 30-minute chart

  • In the short-term, oil is finding support near the 52.00 figure and the 200 SMA suggesting that bulls might come back for a retest of the 52.75 resistance to the upside. 

Additional key levels 

WTI

Overview:
    Today Last Price: 51.99
    Today Daily change: -1.1e+2 pips
    Today Daily change %: -2.04%
    Today Daily Open: 53.07
Trends:
    Previous Daily SMA20: 52
    Previous Daily SMA50: 58.57
    Previous Daily SMA100: 64.62
    Previous Daily SMA200: 66.75
Levels:
    Previous Daily High: 53.48
    Previous Daily Low: 50.57
    Previous Weekly High: 54.2
    Previous Weekly Low: 50.57
    Previous Monthly High: 63.92
    Previous Monthly Low: 49.64
    Previous Daily Fibonacci 38.2%: 52.37
    Previous Daily Fibonacci 61.8%: 51.68
    Previous Daily Pivot Point S1: 51.27
    Previous Daily Pivot Point S2: 49.46
    Previous Daily Pivot Point S3: 48.36
    Previous Daily Pivot Point R1: 54.18
    Previous Daily Pivot Point R2: 55.28
    Previous Daily Pivot Point R3: 57.09

Author

Flavio Tosti

Flavio Tosti

Independent Analyst


More from Flavio Tosti
Share:

Editor's Picks

EUR/USD holds losses near 1.1850 as US, China holidays keep trade muted

EUR/USD opens the week on a softer note, trading near 1.1860 during the Asian session on Monday. Activity is likely to remain muted, with United States markets closed for the Presidents’ Day holiday, while Mainland China is also shut for the week-long Lunar New Year break.

GBP/USD flat lines as traders await key UK macro data and FOMC minutes

The GBP/USD pair kicks off a new week on a subdued note and oscillates in a narrow range, just below mid-1.3600s, during the Asian session. Moreover, the mixed fundamental backdrop warrants some caution for aggressive traders as the market focus now shifts to this week's important releases from the UK and the US.

Gold remains below $5,050 despite Fed rate cut bets, uncertain geopolitical tensions

Gold edges lower after registering over 2% gains in the previous session, trading around $5,030 per troy ounce during the Asian hours on Monday. However, the non-interest-bearing Gold could further gain ground following softer January Consumer Price Index figures, which reinforced expectations that the Federal Reserve could cut rates later this year.

Week ahead: Data blitz, Fed Minutes and RBNZ decision in the spotlight

The US jobs report for January, which was delayed slightly, didn’t do the dovish Fed bets any favours, as expectations of a soft print did not materialize, confounding the raft of weak job indicators seen in the prior week.

Global inflation watch: Signs of cooling services inflation

Realized inflation landed close to expectations in January, as negative base effects weighed on the annual rates. Remaining sticky inflation is largely explained by services, while tariff-driven goods inflation remains limited even in the US.

Ripple Price Forecast: XRP potential bottom could be in sight

Ripple edges up above the intraday low of $1.35 at the time of writing on Friday amid mixed price actions across the crypto market. The remittance token failed to hold support at $1.40 the previous day, reflecting risk-off sentiment amid a decline in retail and institutional sentiment.