|

Oil Technical Analysis: WTI is testing $50.00 a barrel
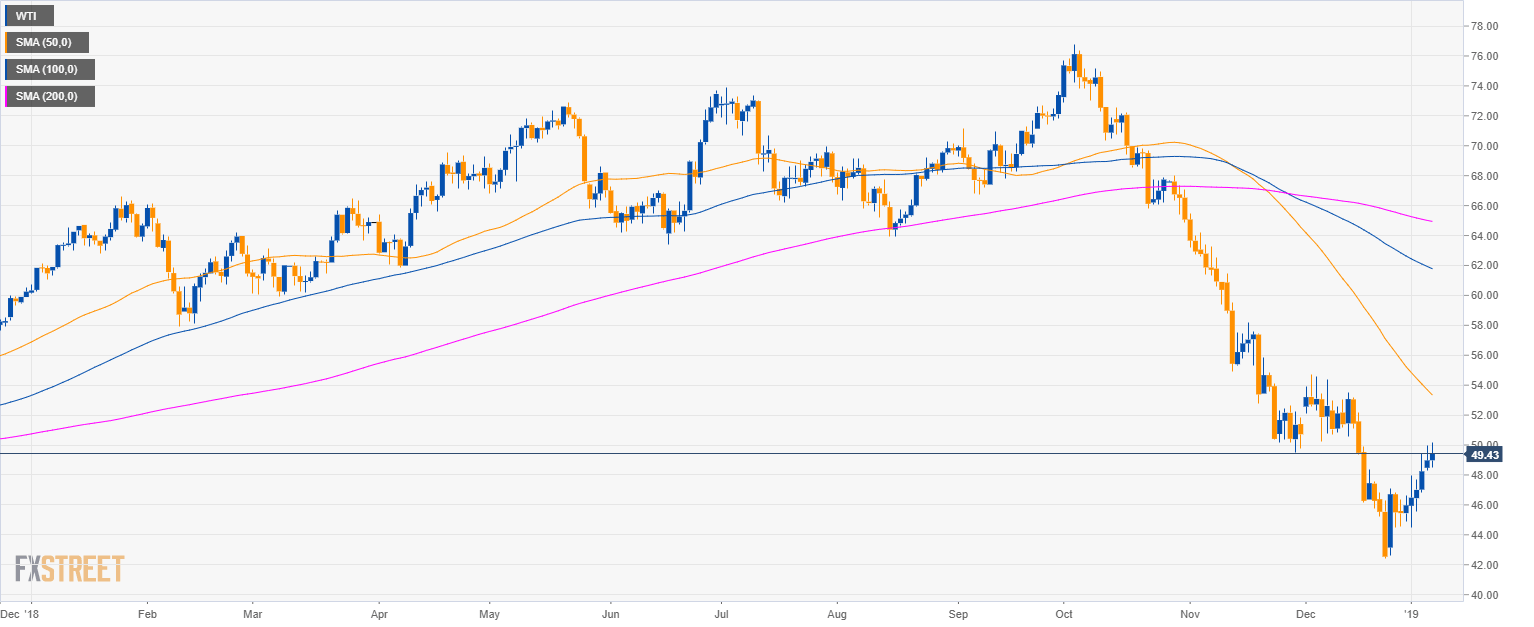
Oil daily chart

  • Crude oil WTI is evolving in a bear trend below the 200-period simple moving average (SMA).
  • Bulls are attempting to generate a reversal up since late December.
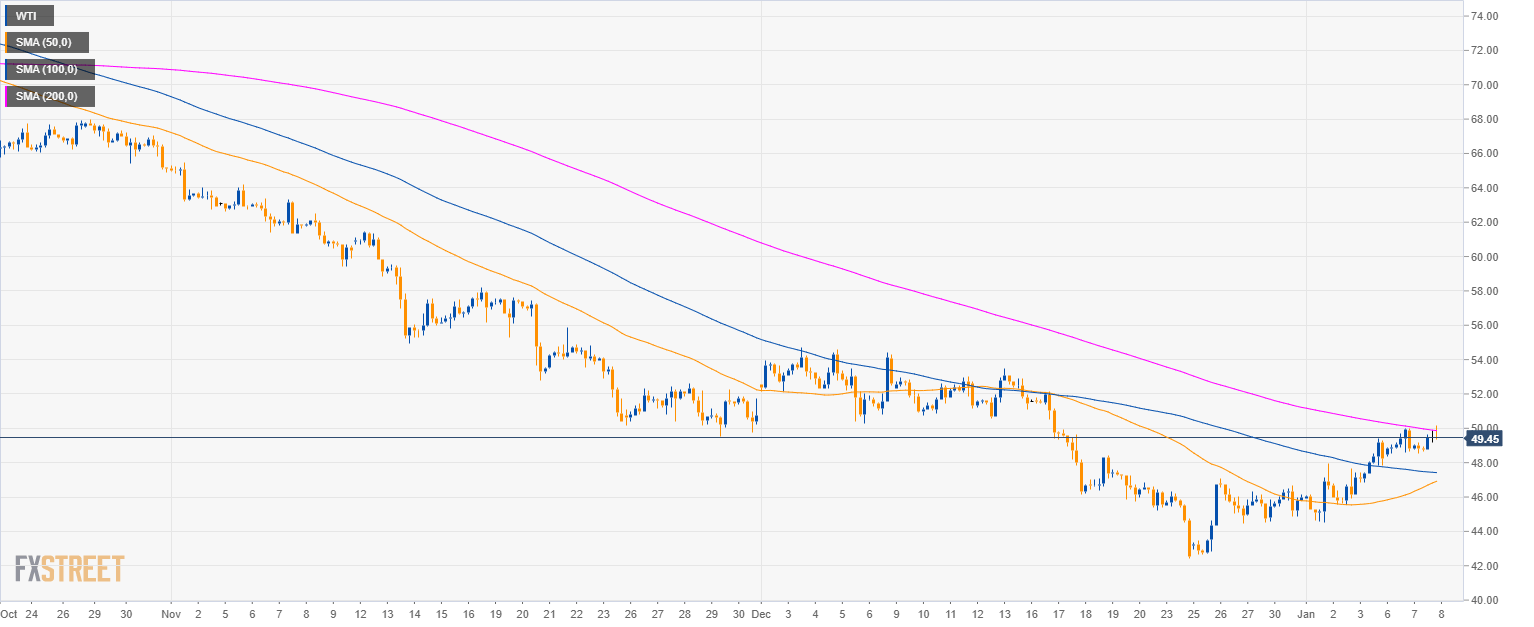
Oil 4-hour chart

  • The 200 SMA is currently capping the bullish advance.
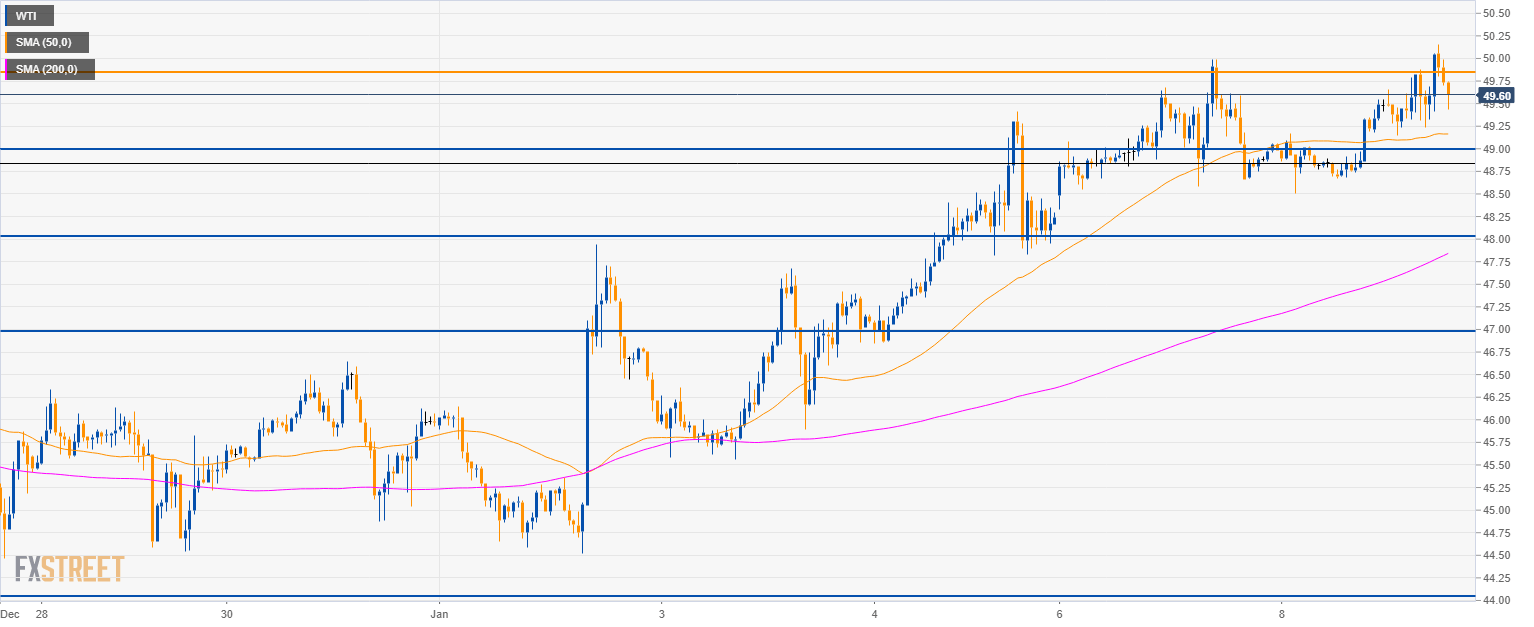
Oil 30-minute chart

  • $50.00 a barrel seems to be acting as strong resistance and at this stage, it is doubtful that bulls have what it takes to break above it this week. 
  • To the downside, support can be seen near the 49.00, 48.00 and 47.00 figures.

Additional key levels

WTI

Overview:
    Today Last Price: 49.55
    Today Daily change: 58 pips
    Today Daily change %: 1.18%
    Today Daily Open: 48.97
Trends:
    Previous Daily SMA20: 48.15
    Previous Daily SMA50: 52.51
    Previous Daily SMA100: 61.36
    Previous Daily SMA200: 65.08
Levels:
    Previous Daily High: 49.99
    Previous Daily Low: 48.33
    Previous Weekly High: 49.41
    Previous Weekly Low: 44.52
    Previous Monthly High: 54.68
    Previous Monthly Low: 42.45
    Previous Daily Fibonacci 38.2%: 49.36
    Previous Daily Fibonacci 61.8%: 48.96
    Previous Daily Pivot Point S1: 48.2
    Previous Daily Pivot Point S2: 47.44
    Previous Daily Pivot Point S3: 46.54
    Previous Daily Pivot Point R1: 49.86
    Previous Daily Pivot Point R2: 50.76
    Previous Daily Pivot Point R3: 51.52

Author

Flavio Tosti

Flavio Tosti

Independent Analyst


More from Flavio Tosti
Share:

Editor's Picks

EUR/USD hovers around nine-day EMA above 1.1800

EUR/USD remains in the positive territory after registering modest gains in the previous session, trading around 1.1820 during the Asian hours on Monday. The 14-day Relative Strength Index momentum indicator at 54 is edging higher, signaling improving momentum. RSI near mid-50s keeps momentum balanced. A sustained push above 60 would firm bullish control.

GBP/USD holds medium-term bullish bias above 1.3600

The GBP/USD pair trades on a softer note around 1.3605 during the early European session on Monday. Growing expectation of the Bank of England’s interest-rate cut weighs on the Pound Sterling against the Greenback. 

Gold sticks to gains above $5,000 as China's buying and Fed rate-cut bets drive demand

Gold surges past the $5,000 psychological mark during the Asian session on Monday in reaction to the weekend data, showing that the People's Bank of China extended its buying spree for a 15th month in January. Moreover, dovish US Federal Reserve expectations and concerns about the central bank's independence drag the US Dollar lower for the second straight day, providing an additional boost to the non-yielding yellow metal. 

Bitcoin, Ethereum and Ripple consolidate after massive sell-off

Bitcoin, Ethereum, and Ripple prices consolidated on Monday after correcting by nearly 9%, 8%, and 10% in the previous week, respectively. BTC is hovering around $70,000, while ETH and XRP are facing rejection at key levels.

Weekly column: Saturn-Neptune and the end of the Dollar’s 15-year bull cycle

Tariffs are not only inflationary for a nation but also risk undermining the trust and credibility that go hand in hand with the responsibility of being the leading nation in the free world and controlling the world’s reserve currency.

Bitcoin, Ethereum and Ripple consolidate after massive sell-off

Bitcoin, Ethereum, and Ripple prices consolidated on Monday after correcting by nearly 9%, 8%, and 10% in the previous week, respectively. BTC is hovering around $70,000, while ETH and XRP are facing rejection at key levels. Traders should be cautious: despite recent stabilization, upside recovery for these top three cryptocurrencies is capped as the broader trend remains bearish.