Oil Technical Analysis: Wedge pattern halts bullish advance near $56.80 a barrel
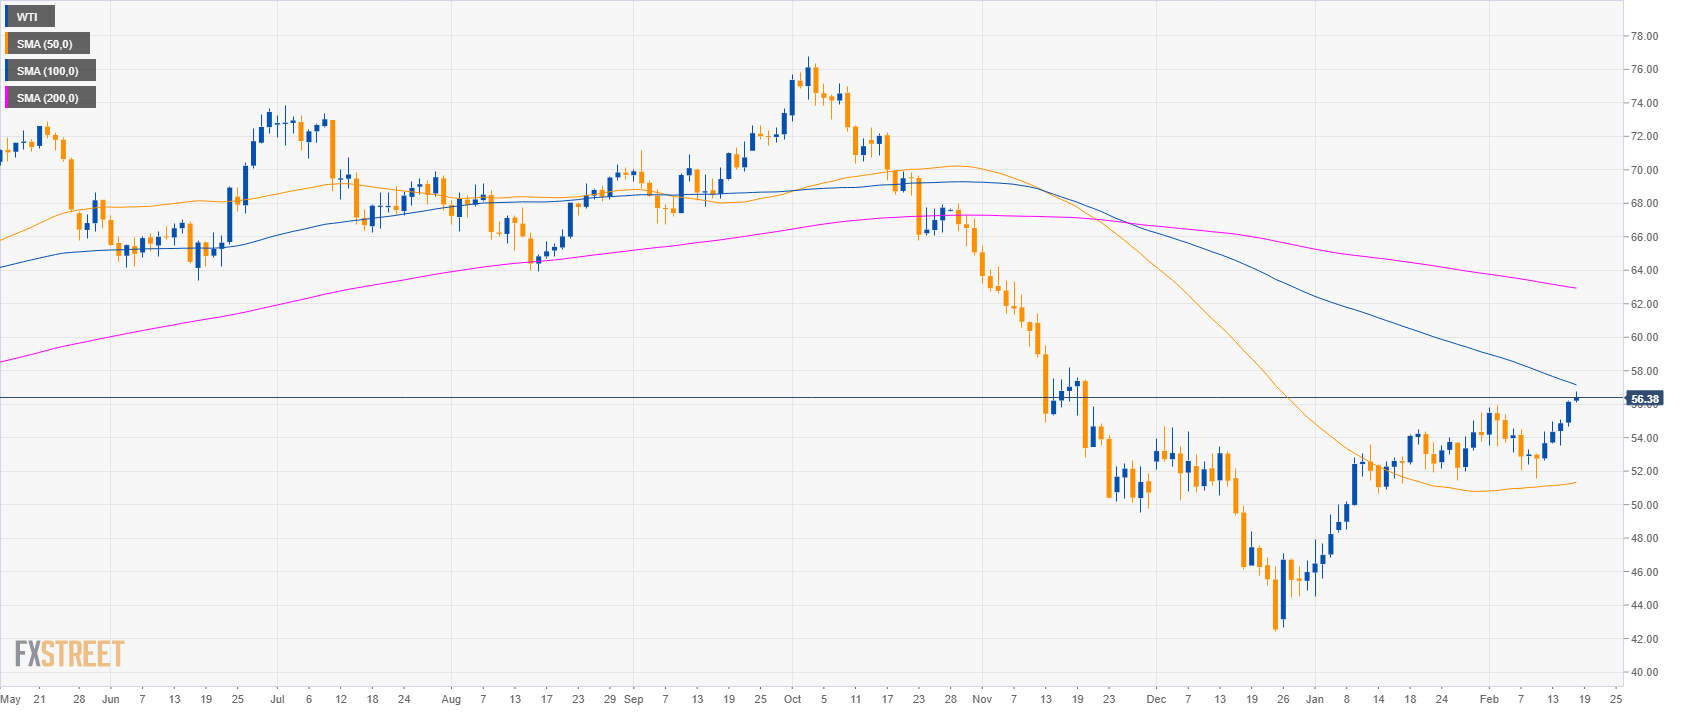

Oil daily chart

  • Crude oil WTI is trading between the 50 and 100 SMA suggesting a sideways market.
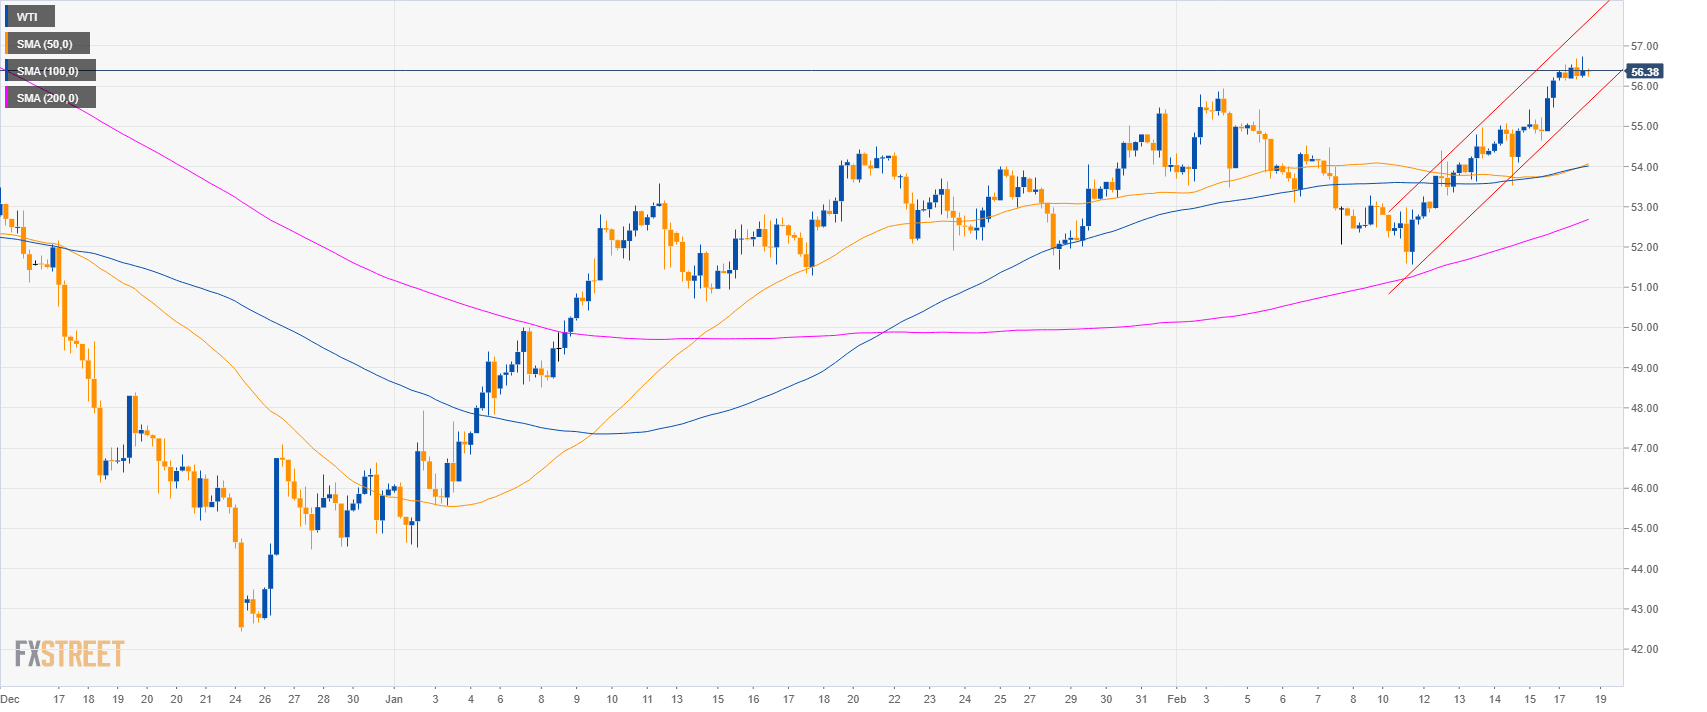
Oil 4-hour chart

  • Crude oil is trading above the main SMAs suggesting bullish momentum in the medium-term. 
  • Crude oil is trading in a tight bull channel.
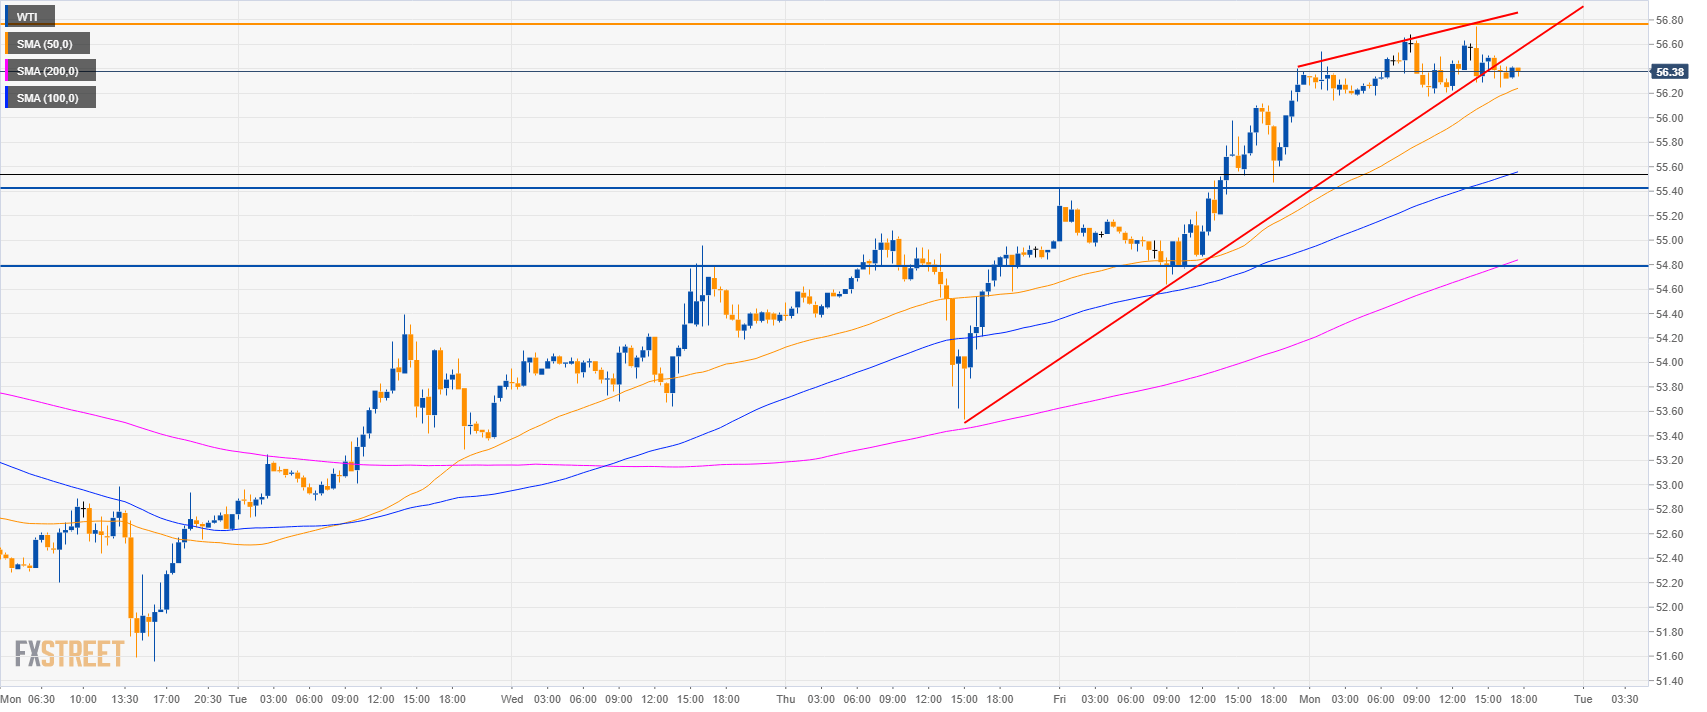
Oil 30-minute chart

  • WTI is trading above its main SMAs suggesting bullish momentum in the short-term. 
  • However, the wedge pattern might see 55.40 and possibly 54.80 revisited to the downside before renewed bullish momentum resumes.
  • Resistance is at $56.80 a barrel. 

Additional key levels

WTI

Overview:
    Today Last Price: 56.38

    Today Daily change %: 0.43%
    Today Daily Open: 56.14
Trends:
    Daily SMA20: 53.85
    Daily SMA50: 51.23
    Daily SMA100: 55.89
    Daily SMA200: 62.86
Levels:
    Previous Daily High: 56.22
    Previous Daily Low: 54.64
    Previous Weekly High: 56.22
    Previous Weekly Low: 51.56
    Previous Monthly High: 55.48
    Previous Monthly Low: 44.52
    Daily Fibonacci 38.2%: 55.62
    Daily Fibonacci 61.8%: 55.24
    Daily Pivot Point S1: 55.11
    Daily Pivot Point S2: 54.09
    Daily Pivot Point S3: 53.53
    Daily Pivot Point R1: 56.69
    Daily Pivot Point R2: 57.25
    Daily Pivot Point R3: 58.27


Share: Feed news

Note: All information on this page is subject to change. The use of this website constitutes acceptance of our user agreement. Please read our privacy policy and legal disclaimer. Opinions expressed at FXstreet.com are those of the individual authors and do not necessarily represent the opinion of FXstreet.com or its management. Risk Disclosure: Trading foreign exchange on margin carries a high level of risk, and may not be suitable for all investors. The high degree of leverage can work against you as well as for you. Before deciding to invest in foreign exchange you should carefully consider your investment objectives, level of experience, and risk appetite. The possibility exists that you could sustain a loss of some or all of your initial investment and therefore you should not invest money that you cannot afford to lose. You should be aware of all the risks associated with foreign exchange trading, and seek advice from an independent financial advisor if you have any doubts.

Recommended content


Recommended content

Editors’ Picks

EUR/USD nears 1.0800 on broad US Dollar weakness

EUR/USD nears 1.0800 on broad US Dollar weakness

Optimism continues to undermine demand for the American currency ahead of the weekly close. EUR/USD hovers around weekly highs just ahead of the 1.0900 figure.

EUR/USD News

GBP/USD reconquers 1.2500 with upbeat UK GDP

GBP/USD reconquers 1.2500 with upbeat UK GDP

Following BOE-inspired slump on Thursday, the British Pound changed course and trades around 1.2530. Better-than-anticipated UK GDP and a weaker USD behind the advance.

GBP/USD News

Gold resumes advance and trades above $2,370

Gold resumes advance and trades above $2,370

XAU/USD accelerated its recovery on Friday, as investors drop the USD. Dismal US employment-related figures revived hopes for a soon-to-come rate cut from the Fed.

Gold News

XRP tests support at $0.50 as Ripple joins alliance to work on blockchain recovery

XRP tests support at $0.50 as Ripple joins alliance to work on blockchain recovery

XRP trades around $0.5174 early on Friday, wiping out gains from earlier in the week, as Ripple announced it has joined an alliance to support digital asset recovery alongside Hedera and the Algorand Foundation. 

Read more

Week ahead – US inflation numbers to shake Fed rate cut bets

Week ahead – US inflation numbers to shake Fed rate cut bets

Fed rate-cut speculators rest hopes on US inflation data. After dovish BoE, pound traders turn to UK job numbers. Will a strong labor market convince the RBA to hike? More Chinese data on tap amid signs of slow Q2 start.

Read more

Forex MAJORS

Cryptocurrencies

Signatures