Oil Price Forecast: WTI recovers above $65 as focus shifts to OPEC
- West Texas Intermediate (WTI) shrugs off the rising inventory report with the price extending gains from Tuesday.
- WTI Crude Oil heads toward $66.00 with psychological support firming at $65.00.
- The US Crude Oil benchmark remains vulnerable to shifts in supply and demand ahead of the OPEC+ meeting scheduled for July 6.

West Texas Intermediate (WTI) is extending gains as the US Crude Oil benchmark rises above $65.00.
At the time of writing, WTI is trading near $65.85, with intraday gains of nearly 1.50%
The weekly US Energy Information Administration (EIA) report released on Wednesday revealed that Crude Oil stockpiles rose by 3.845 million barrels.
Expectations had been for the latest report to show a drawdown of 2 million barrels.
Despite easing supply concerns, WTI Crude Oil extended its gains. The latest recovery, which began on Tuesday, follows a 12% decline last week.
This has pushed prices above the $65.00 psychological level, which is providing imminent support for the near-term move.
For the next significant move, technical levels may continue to influence the direction of WTI Crude Oil ahead of the Organisation of Petroleum Exporting Countries and its allies (OPEC+) meeting scheduled for July 6.
WTI holds above psychological support as markets await OPEC+ decision
While the OPEC+ are expected to increase production by an additional 411,000 barrels per day in August, demand for Oil continues to rise.
In anticipation of the next meeting, WTI has stabilised above the 38.2% Fibonacci retracement level of the January-April decline at $64.18.
The June low of $63.73 provides additional support, with the 50-day Simple Moving Average (SMA) at $63.47 serving as a technical floor following.
Momentum indicators are currently reflecting a neutral tone.
The Relative Strength Index (RSI) is hovering near 48, suggesting a lack of directional conviction.
Meanwhile, the Commodity Channel Index (CCI) near - 43 shows mildly bearish momentum without entering oversold territory.
WTI (US Crude) Oil daily chart
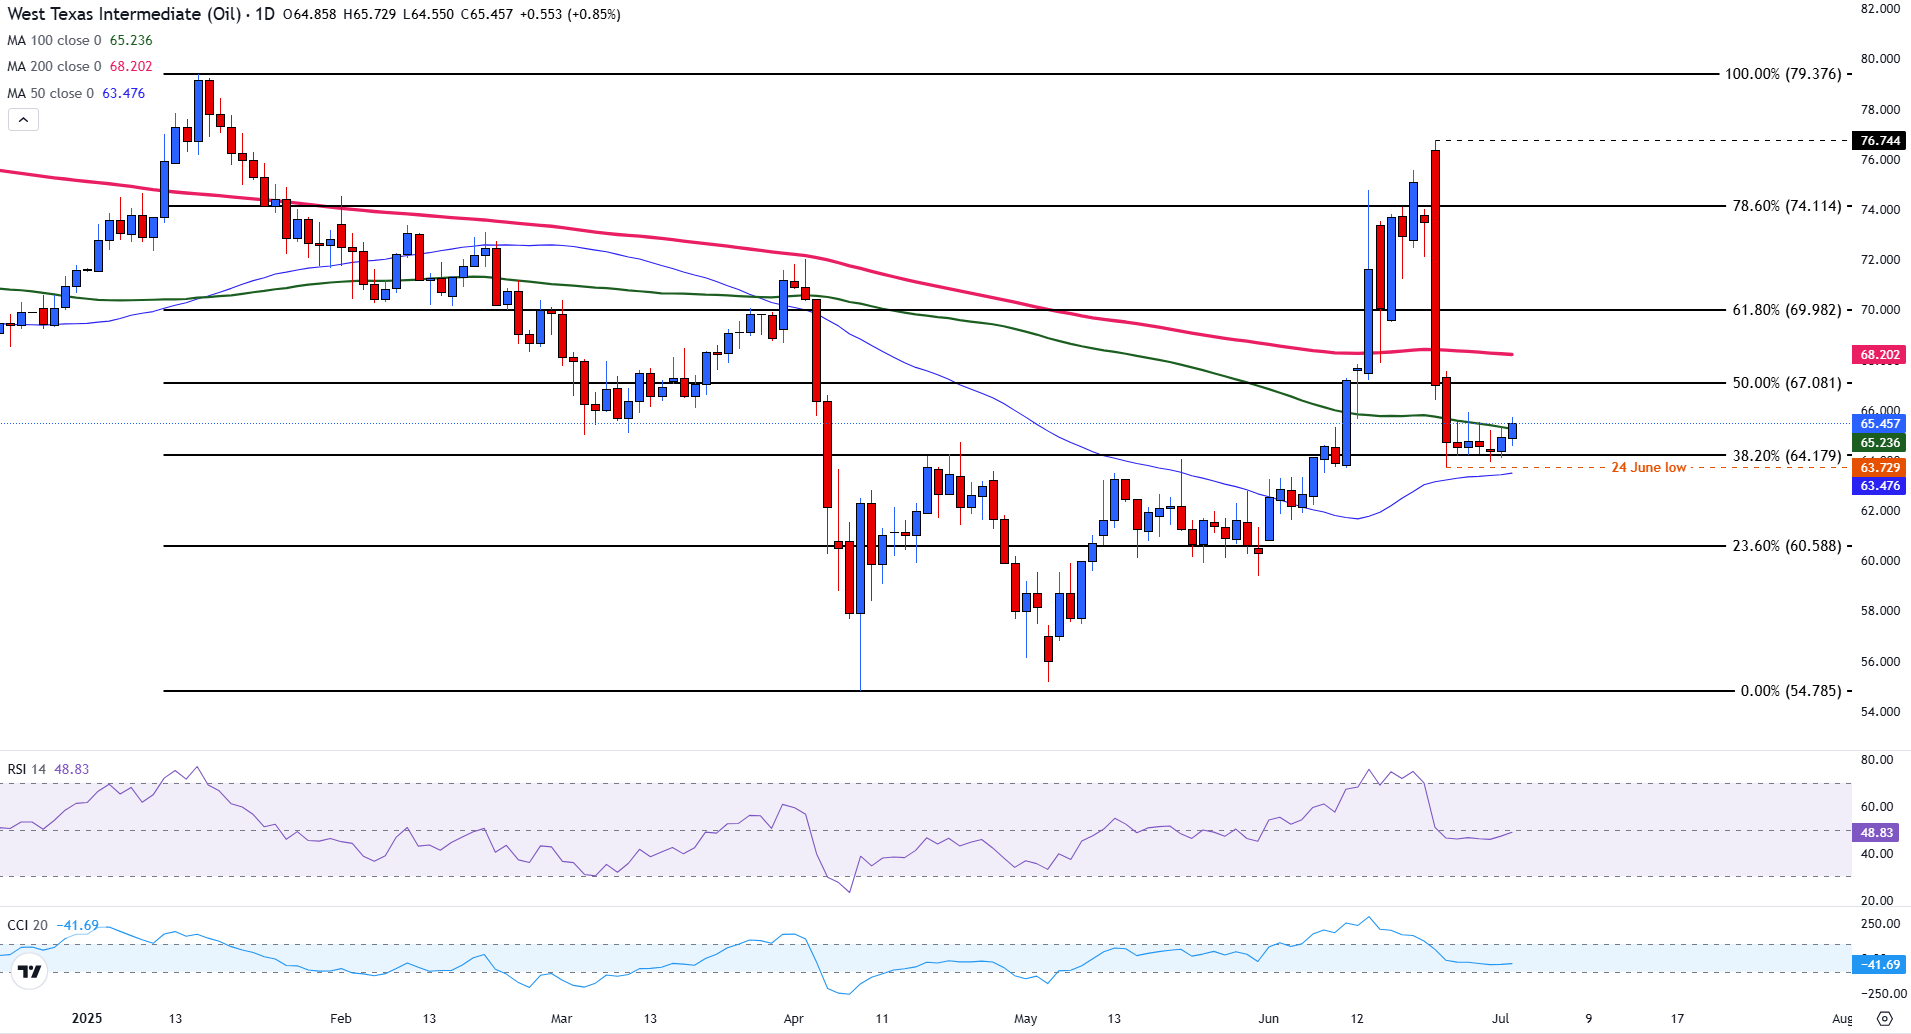
A sustained break above $67.08 (50% retracement) could open the door for a recovery.
If prices hold above key support and break through $67.08, rising above the $70 psychological level, a surge in bullish momentum could pave the way for the 78.6% Fibonacci level at $74.11.
WTI Oil FAQs
WTI Oil is a type of Crude Oil sold on international markets. The WTI stands for West Texas Intermediate, one of three major types including Brent and Dubai Crude. WTI is also referred to as “light” and “sweet” because of its relatively low gravity and sulfur content respectively. It is considered a high quality Oil that is easily refined. It is sourced in the United States and distributed via the Cushing hub, which is considered “The Pipeline Crossroads of the World”. It is a benchmark for the Oil market and WTI price is frequently quoted in the media.
Like all assets, supply and demand are the key drivers of WTI Oil price. As such, global growth can be a driver of increased demand and vice versa for weak global growth. Political instability, wars, and sanctions can disrupt supply and impact prices. The decisions of OPEC, a group of major Oil-producing countries, is another key driver of price. The value of the US Dollar influences the price of WTI Crude Oil, since Oil is predominantly traded in US Dollars, thus a weaker US Dollar can make Oil more affordable and vice versa.
The weekly Oil inventory reports published by the American Petroleum Institute (API) and the Energy Information Agency (EIA) impact the price of WTI Oil. Changes in inventories reflect fluctuating supply and demand. If the data shows a drop in inventories it can indicate increased demand, pushing up Oil price. Higher inventories can reflect increased supply, pushing down prices. API’s report is published every Tuesday and EIA’s the day after. Their results are usually similar, falling within 1% of each other 75% of the time. The EIA data is considered more reliable, since it is a government agency.
OPEC (Organization of the Petroleum Exporting Countries) is a group of 12 Oil-producing nations who collectively decide production quotas for member countries at twice-yearly meetings. Their decisions often impact WTI Oil prices. When OPEC decides to lower quotas, it can tighten supply, pushing up Oil prices. When OPEC increases production, it has the opposite effect. OPEC+ refers to an expanded group that includes ten extra non-OPEC members, the most notable of which is Russia.
Author

Tammy Da Costa, CFTe®
FXStreet
Tammy is an economist and market analyst with a deep passion for financial markets, particularly commodities and geopolitics.


