Oil Price Forecast: WTI rallies to $74 before settling above $72
- WTI Oil surges above $72 as Israel-Iran tensions trigger a breakout.
- Gains for June are near 20%, pushing prices above key Fibonacci levels from longer-term moves.
- The 12-month moving average provides additional support below $70.

WTI crude oil is surging amid escalating geopolitical tensions, with Israel’s recent strikes on Iran fueling a rally that pushed prices above the $74.00 handle on Friday. At the time of writing, WTI is trading just below $72.00 after Iran responded with its own missile barrage, marking a near 20% gain for June and reversing much of the weakness observed earlier this year.
Despite broad-based pressure in the first half of 2025, the recent price surge has lifted WTI back above several key technical levels, with bullish momentum building across multiple timeframes.
WTI Oil long-term setup
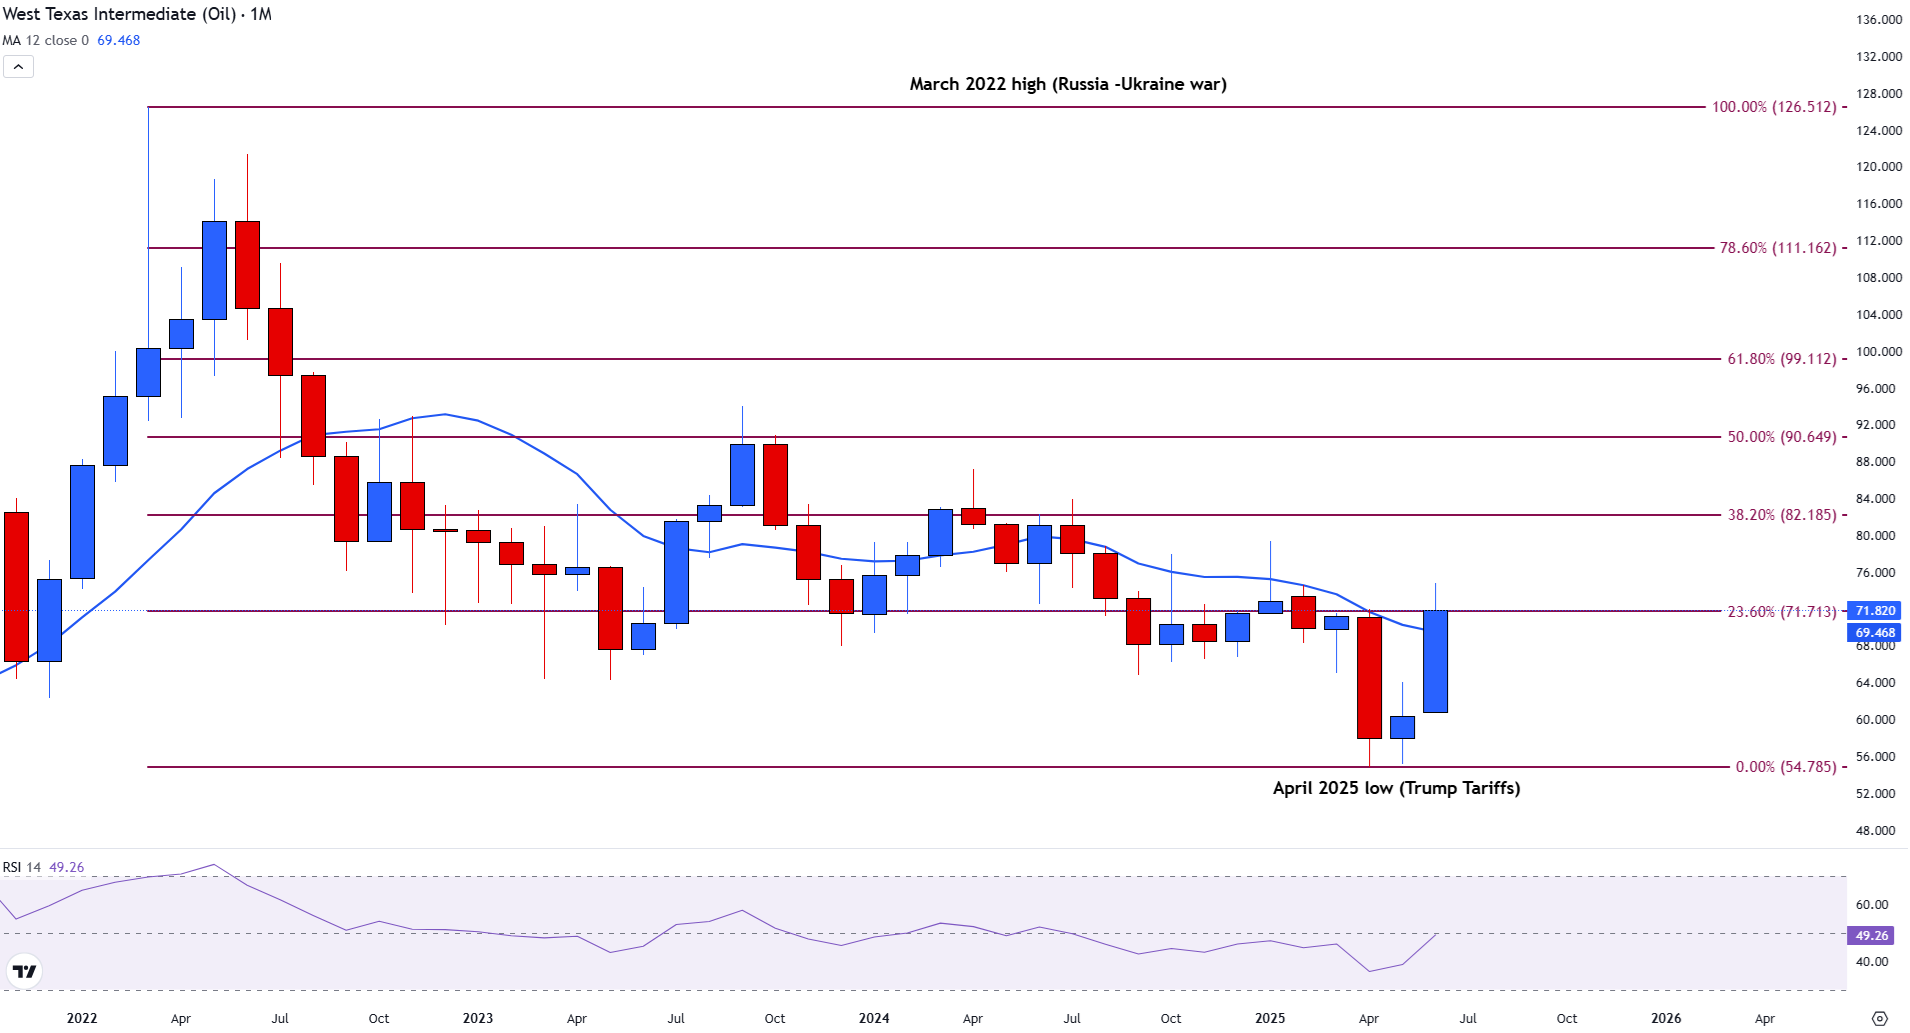
From a longer-term perspective, WTI has reclaimed the 12-month Simple Moving Average (SMA), currently sitting at $69.46. This level now serves as dynamic support. Above, resistance is forming at the 23.6% Fibonacci retracement of the March 2022 high to the April 2025 low, located at $71.71.
WTI Oil Monthly Chart
WTI Oil medium-term setup
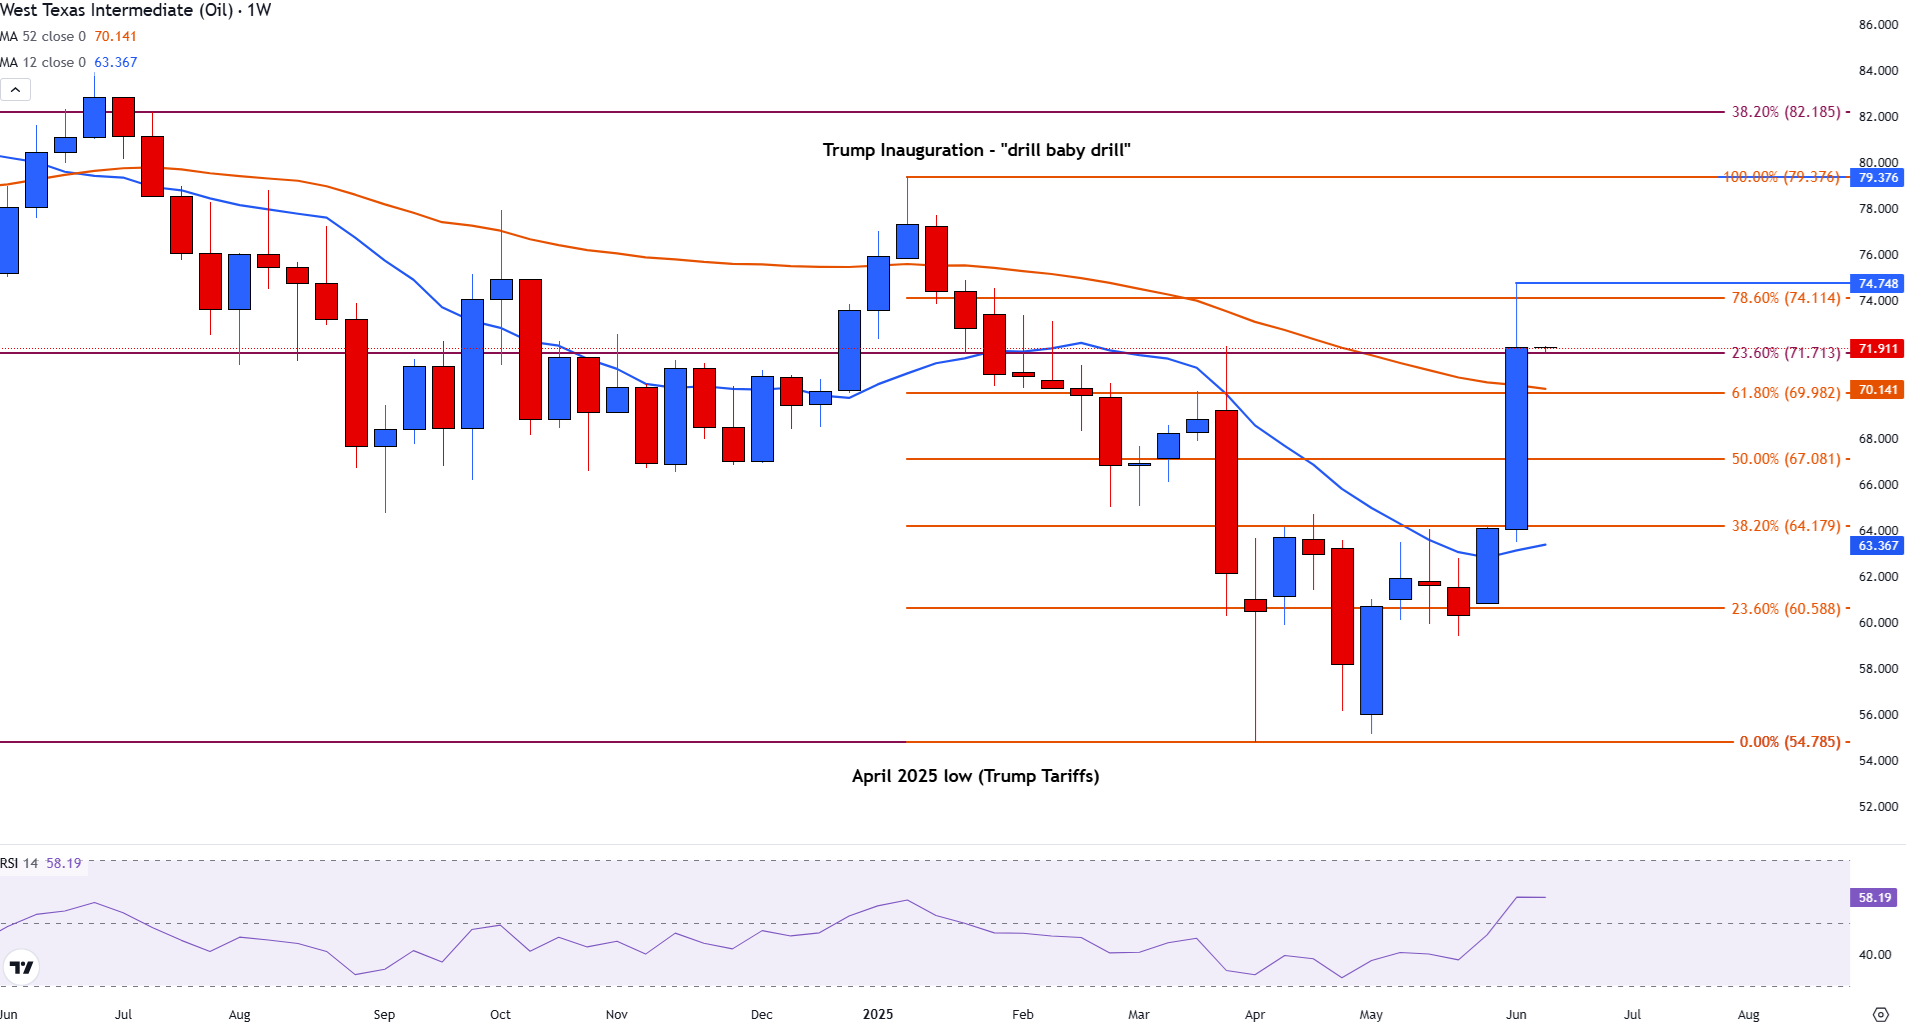
On the weekly chart, WTI broke above the 12-week SMA at $63.29 following the Iran-Israel escalation, marking a pivotal shift in sentiment. This surge has brought prices up to the 78.6% Fibonacci retracement of the January–April decline at $74.11. The 12-week SMA continues to offer support near $63.31, underlining a strong base for bulls.
WTI Oil Weekly Chart
WTI Oil short-term setup
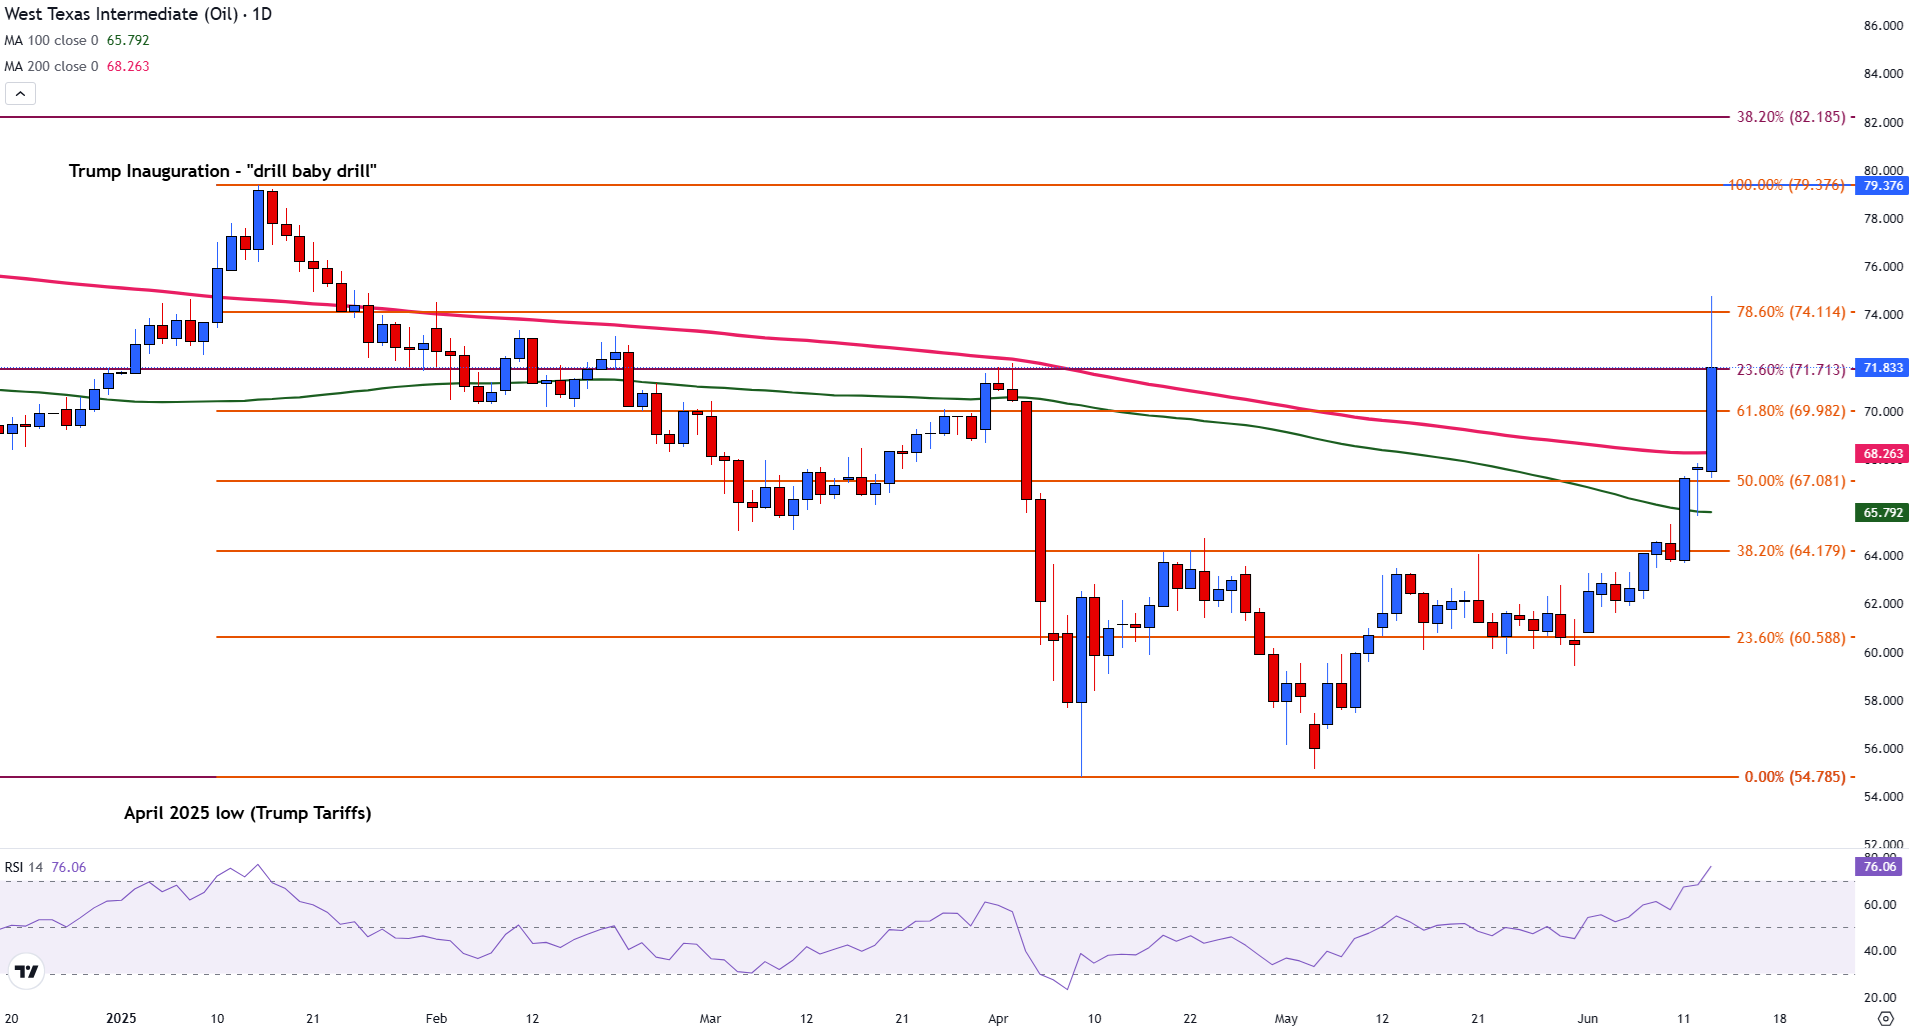
Zooming into the daily chart, Friday’s bullish momentum drove a decisive move above both the 100-day and 200-day SMAs, strengthening the case for further upside. Technical confluence with long-term Fibonacci levels adds credibility to the breakout.
The Relative Strength Index (RSI) on the daily timeframe currently sits at 76, signaling overbought conditions. However, with the geopolitical backdrop intensifying, fundamental support may ultimately prevail over short-term exhaustion.
WTI Oil Daily Chart
Looking ahead: What’s next for Oil?
If WTI breaks and holds above $74.11 early next week, momentum could carry it toward $76.00 and eventually $78.00. Conversely, failure to maintain levels above $71.71 may trigger a retracement, especially if geopolitical tensions ease or if market focus returns to demand-side concerns.
Author

Tammy Da Costa, CFTe®
FXStreet
Tammy is an economist and market analyst with a deep passion for financial markets, particularly commodities and geopolitics.