NZD/USD Price Forecast: Targets 0.5700 after breaking above nine-day EMA
- NZD/USD may find primary support at the crucial level of 0.5650.
- A rebound above the nine-day EMA signals improving short-term price momentum.
- An initial hurdle emerges at the psychological 0.5700 level.

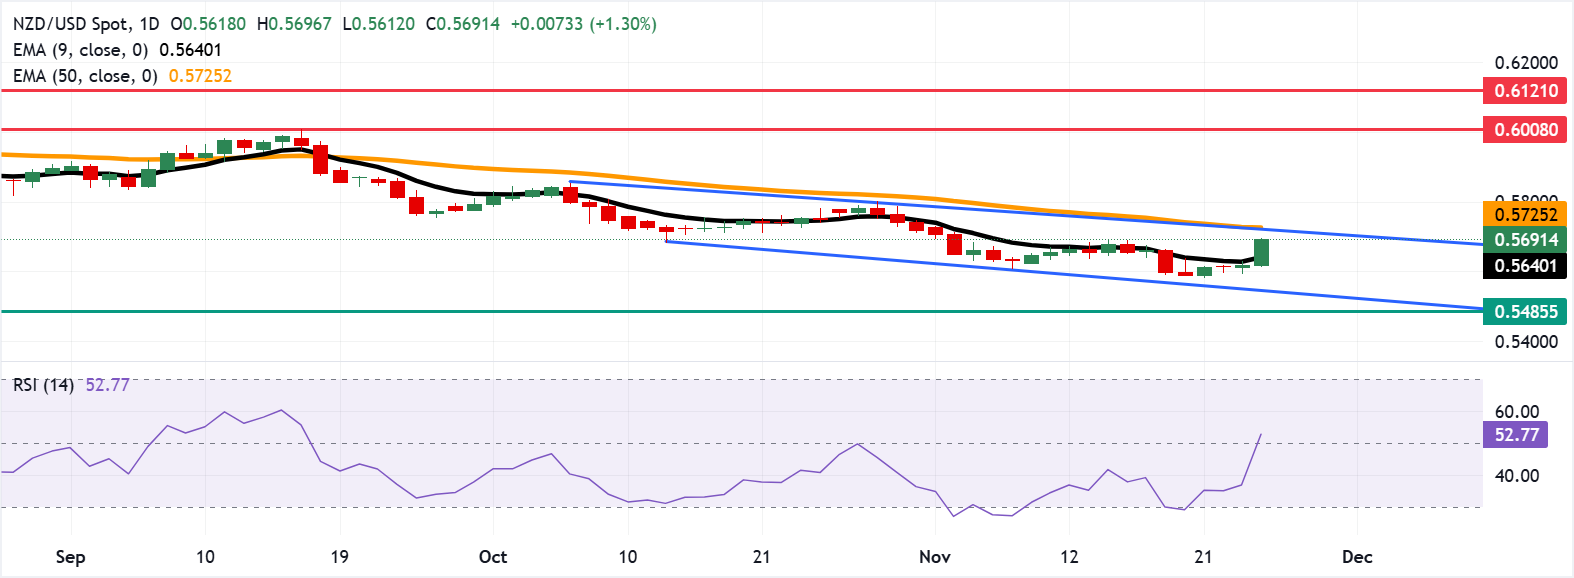
NZD/USD trades higher by more than 1%, trading around 0.5690 during the Asian hours on Wednesday. The technical analysis of the daily chart signals a persistent bearish bias as the pair price remains within the descending channel pattern.
The NZD/USD pair remains below the falling 50-day Exponential Moving Average (EMA), preserving the broader downside bias, while a rebound above the nine-day EMA signals improving near-term traction.
Short-term moving averages point to basing, with the nine-day EMA acting as initial support and the 50-day EMA capping the bounce. A sustained move through the latter would improve the outlook. A failure to hold above the nine-day EMA would keep downside risks in play.
The 14-day Relative Strength Index (RSI) at 52.0 (neutral) has turned higher and supports a mild recovery. RSI near the midline confirms stabilizing momentum that could enable an extension.
On the downside, the NZD/USD pair could find its immediate support at the crucial level of 0.5650, followed by the nine-day EMA of 0.5640. A break below this confluence support zone would strengthen the bearish bias and prompt the pair to test the lower boundary of the descending channel around 0.5550, followed by the five-year low of 0.5485, which was recorded on April 9, 2025.
An immediate barrier lies at the psychological level of 0.5700, followed by the descending channel’s upper boundary around 0.5720, which is aligned with the 50-day EMA of 0.5725. A daily close above the 50-day EMA could shift the bias toward further upside and support the NZD/USD pair to explore the region around the three-month high of 0.6008, reached on September 17.
(The technical analysis of this story was written with the help of an AI tool.)
New Zealand Dollar Price Today
The table below shows the percentage change of New Zealand Dollar (NZD) against listed major currencies today. New Zealand Dollar was the strongest against the US Dollar.
| USD | EUR | GBP | JPY | CAD | AUD | NZD | CHF | |
|---|---|---|---|---|---|---|---|---|
| USD | -0.20% | -0.24% | -0.09% | -0.21% | -0.54% | -1.30% | -0.21% | |
| EUR | 0.20% | -0.04% | 0.13% | -0.00% | -0.34% | -1.09% | -0.01% | |
| GBP | 0.24% | 0.04% | 0.16% | 0.04% | -0.30% | -1.05% | 0.03% | |
| JPY | 0.09% | -0.13% | -0.16% | -0.13% | -0.46% | -1.21% | -0.12% | |
| CAD | 0.21% | 0.00% | -0.04% | 0.13% | -0.35% | -1.10% | -0.01% | |
| AUD | 0.54% | 0.34% | 0.30% | 0.46% | 0.35% | -0.76% | 0.33% | |
| NZD | 1.30% | 1.09% | 1.05% | 1.21% | 1.10% | 0.76% | 1.10% | |
| CHF | 0.21% | 0.01% | -0.03% | 0.12% | 0.00% | -0.33% | -1.10% |
The heat map shows percentage changes of major currencies against each other. The base currency is picked from the left column, while the quote currency is picked from the top row. For example, if you pick the New Zealand Dollar from the left column and move along the horizontal line to the US Dollar, the percentage change displayed in the box will represent NZD (base)/USD (quote).
Author

Akhtar Faruqui
FXStreet
Akhtar Faruqui is a Forex Analyst based in New Delhi, India. With a keen eye for market trends and a passion for dissecting complex financial dynamics, he is dedicated to delivering accurate and insightful Forex news and analysis.


