NZD/USD Price Forecast: Slides to near 0.5900
- NZD/USD slumps to near 0.5900 as the US Dollar capitalizes on upbeat US S&P Global PMI data for May.
- The US Composite PMI increased to 52.1 from 50.6 in April.
- Trump’s tax bill is expected to accelerate fiscal imbalances.

The NZD/USD pair is falling to near the round level of 0.5900 during North American trading hours on Thursday. The Kiwi pair slumps after the release of the stronger-than-projected United States (US) Purchasing Managers’ Index (PMI) data for May.
The PMI report showed that the overall business activity in the private sector expanded at a robust pace, with a meaningful increase in output in both the manufacturing and the services sectors. The Composite PMI came in significantly higher at 52.1 from 50.6 in April.
Upbeat US PMI data led to a sharp increase in the demand for the US Dollar (USD), with the US Dollar Index (DXY) rising to near 99.90.
Meanwhile, the outlook of the US Dollar remains uncertain as the approval of President Donald Trump’s new tax bill in the House of Representatives is expected to escalate fiscal imbalances.
On the Kiwi front, New Zealand Trade balance data for April has come in surprisingly stronger than projected. On the month, the Trade Surplus came in at 1.43 billion New Zealand Dollars (NZD), higher than 794 million NZD and estimates of 0.5K million NZD.
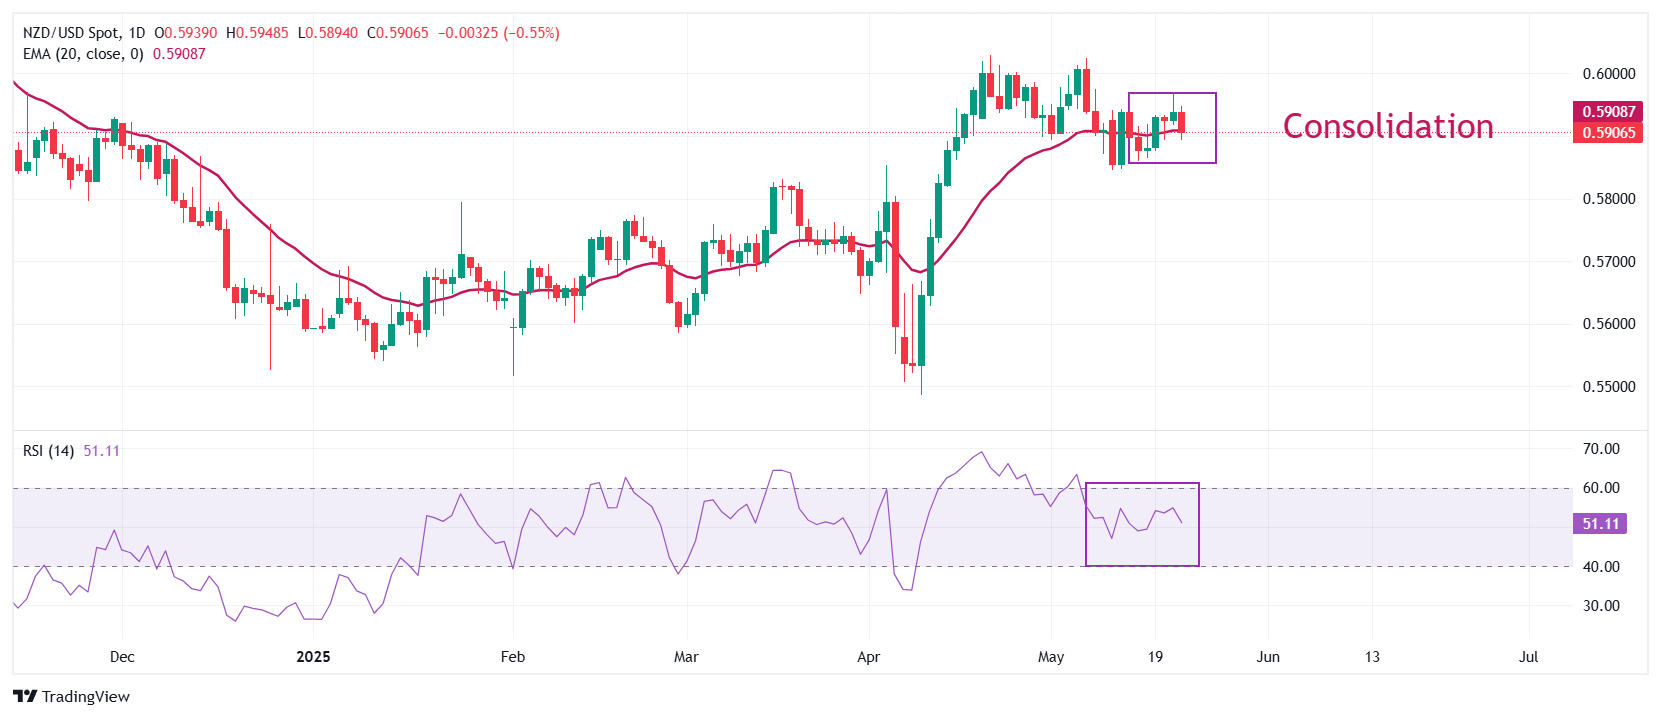
NZD/USD has consolidated in a tight range between 0.5895 and 0.5968 for over a week. The pair wobbles around the 20-day Exponential Moving Average (EMA), indicating a sideways trend.
The 14-day Relative Strength Index (RSI) oscillates inside the 40.00-60.00 range, suggesting a sharp volatility contraction.
A downside move towards the April 4 high of 0.5803 and the April 11 low of 0.5730 would be feasible if the pair extends its downside below the 200-day EMA of 0.5860.
In an alternate scenario, an upside move towards the October 9 low of 0.6052 and the round level of 0.6100 can be counted if the pair breaks above the psychological level of 0.6000.
NZD/USD daily chart
US Dollar FAQs
The US Dollar (USD) is the official currency of the United States of America, and the ‘de facto’ currency of a significant number of other countries where it is found in circulation alongside local notes. It is the most heavily traded currency in the world, accounting for over 88% of all global foreign exchange turnover, or an average of $6.6 trillion in transactions per day, according to data from 2022. Following the second world war, the USD took over from the British Pound as the world’s reserve currency. For most of its history, the US Dollar was backed by Gold, until the Bretton Woods Agreement in 1971 when the Gold Standard went away.
The most important single factor impacting on the value of the US Dollar is monetary policy, which is shaped by the Federal Reserve (Fed). The Fed has two mandates: to achieve price stability (control inflation) and foster full employment. Its primary tool to achieve these two goals is by adjusting interest rates. When prices are rising too quickly and inflation is above the Fed’s 2% target, the Fed will raise rates, which helps the USD value. When inflation falls below 2% or the Unemployment Rate is too high, the Fed may lower interest rates, which weighs on the Greenback.
In extreme situations, the Federal Reserve can also print more Dollars and enact quantitative easing (QE). QE is the process by which the Fed substantially increases the flow of credit in a stuck financial system. It is a non-standard policy measure used when credit has dried up because banks will not lend to each other (out of the fear of counterparty default). It is a last resort when simply lowering interest rates is unlikely to achieve the necessary result. It was the Fed’s weapon of choice to combat the credit crunch that occurred during the Great Financial Crisis in 2008. It involves the Fed printing more Dollars and using them to buy US government bonds predominantly from financial institutions. QE usually leads to a weaker US Dollar.
Quantitative tightening (QT) is the reverse process whereby the Federal Reserve stops buying bonds from financial institutions and does not reinvest the principal from the bonds it holds maturing in new purchases. It is usually positive for the US Dollar.
Author

Sagar Dua
FXStreet
Sagar Dua is associated with the financial markets from his college days. Along with pursuing post-graduation in Commerce in 2014, he started his markets training with chart analysis.


