NZD/USD Price Forecast: Rebounds above 0.5700 following RBNZ Orr’s speech
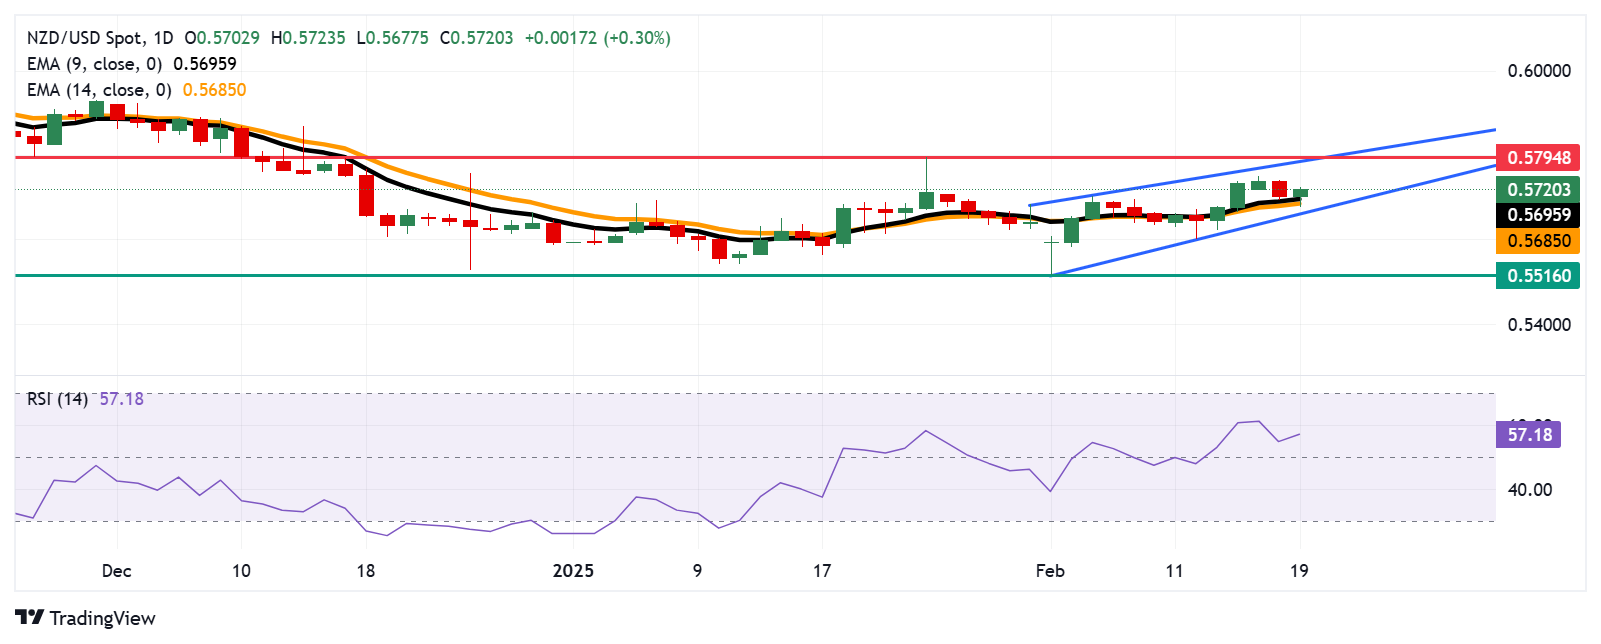
- NZD/USD could rise toward the upper boundary of the ascending channel at 0.5790 level.
- The 14-day RSI remains above the 50 mark, strengthening the bullish sentiment.
- The immediate supports appear at nine- and 14-day EMAs of 0.5695 and 0.5685, respectively.

The NZD/USD pair trades near 0.5710 during Asian hours on Wednesday. However, the pair faced challenges following the Reserve Bank of New Zealand’s (RBNZ) decision to lower the Official Cash Rate (OCR) by 50 basis points (bps) from 4.25% to 3.75%.
RBNZ Governor Adrian Orr delivers prepared remarks on the policy statement and addresses media questions at the post-meeting press conference. Orr said that the OCR path forecasts a 50 bps reduction by mid-year, likely around July, in two 25 bps increments. The economy has substantial spare capacity, making rate cuts in April and May appropriate.
Technical analysis of the daily chart indicates a bullish market sentiment, with the pair remaining within an ascending channel pattern. The 14-day Relative Strength Index (RSI) stays above the 50 mark, reinforcing the bullish outlook. Additionally, the NZD/USD pair is positioned above the nine- and 14-day Exponential Moving Averages (EMAs), signaling a stronger short-term momentum.
To the upside, the NZD/USD pair could rise toward the upper boundary of the ascending channel at the 0.5790 level, followed by the two-month high of 0.5794, reached on January 24.
The NZD/USD pair tests immediate support at the nine-day EMA at 0.5695, followed by a 14-day EMA at 0.5685 level. Further support region appears at the ascending channel’s lower boundary at 0.5650 level.
A break below the channel would weaken the bullish bias and put downward pressure on the NZD/USD pair to navigate the region around 0.5516, its lowest point since October 2022, recorded on February 3.
NZD/USD: Daily Chart
New Zealand Dollar PRICE Today
The table below shows the percentage change of New Zealand Dollar (NZD) against listed major currencies today. New Zealand Dollar was the strongest against the Japanese Yen.
| USD | EUR | GBP | JPY | CAD | AUD | NZD | CHF | |
|---|---|---|---|---|---|---|---|---|
| USD | -0.03% | -0.07% | 0.00% | -0.03% | -0.15% | -0.27% | 0.00% | |
| EUR | 0.03% | -0.04% | 0.06% | -0.00% | -0.12% | -0.24% | 0.03% | |
| GBP | 0.07% | 0.04% | 0.08% | 0.04% | -0.08% | -0.20% | 0.07% | |
| JPY | 0.00% | -0.06% | -0.08% | -0.05% | -0.17% | -0.30% | -0.02% | |
| CAD | 0.03% | 0.00% | -0.04% | 0.05% | -0.12% | -0.24% | 0.03% | |
| AUD | 0.15% | 0.12% | 0.08% | 0.17% | 0.12% | -0.11% | 0.15% | |
| NZD | 0.27% | 0.24% | 0.20% | 0.30% | 0.24% | 0.11% | 0.27% | |
| CHF | -0.00% | -0.03% | -0.07% | 0.02% | -0.03% | -0.15% | -0.27% |
The heat map shows percentage changes of major currencies against each other. The base currency is picked from the left column, while the quote currency is picked from the top row. For example, if you pick the New Zealand Dollar from the left column and move along the horizontal line to the US Dollar, the percentage change displayed in the box will represent NZD (base)/USD (quote).
Author

Akhtar Faruqui
FXStreet
Akhtar Faruqui is a Forex Analyst based in New Delhi, India. With a keen eye for market trends and a passion for dissecting complex financial dynamics, he is dedicated to delivering accurate and insightful Forex news and analysis.


