|

NZD/USD Price Analysis: Symmetrical triangle conveys volatility contraction, US NFP eyed

  • NZD/USD is expected to display back-and-forth action ahead of the US NFP release.
  • The Symmetrical Triangle formation is hinting a sheer volatility squeeze.
  • A range shift by the RSI (14) into the 40.00-60.00 zone from the bullish range of 60.00-80.00 indicates a consolidation ahead.

The NZD/USD pair is demonstrating a sideways action below the immediate resistance of 0.6480 in the Asian session. The Kiwi asset has turned sideways as investors are awaiting the release of the Caixin Services PMI and United States Nonfarm Payrolls (NFP) data for fresh impetus.

Weak earnings have dented the three-day winning spell of the S&P500 futures, which are showing significant losses, portraying a risk aversion theme. The US Dollar Index (DXY) is looking to recapture Thursday’s high around 101.55 after a corrective move as investors’ risk appetite has faded significantly.

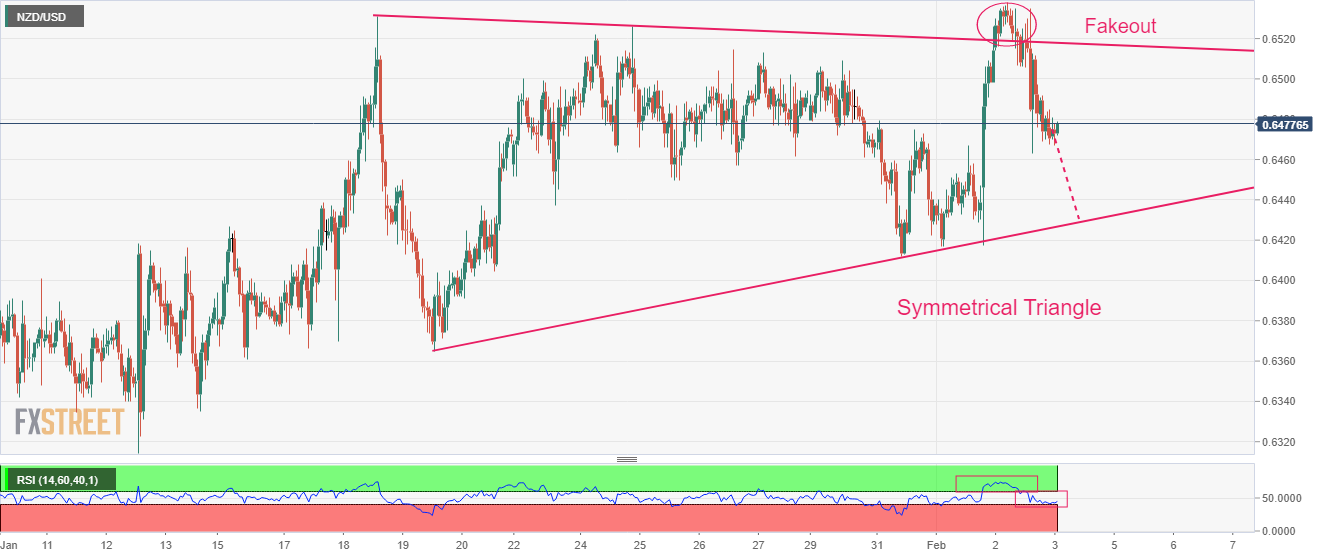
NZD/USD is auctioning in a Symmetrical Triangle chart pattern that indicates an extreme squeeze in volatility. The upward-sloping trendline of the chart pattern is placed from January 19 low at 0.6365 while the downward-sloping trendline is plotted from January 18 high at 0.6531. The Kiwi asset displayed a sheer fall on Thursday after failing to find buying strength post delivering a breakout, which resulted in a fakeout later and trapped investors at elevated levels.

The Relative Strength Index (RSI) (14) has shifted into the 40.00-60.00 range from the bullish range of 60.00-80.00, which indicates a consolidation ahead.

For the downside move, a breakdown below January 31 low at 0.6412 will drag the Kiwi asset toward January 17 low at 0.6366 followed by January 12 low around 0.6300.

On the flip side, the asset needs to surpass Thursday’s high at 0.6538 for resuming the upside move, which will drive the asset toward June 3 high at 0.6576. A breach of the latter will expose the asset to the round-level resistance at 0.6600.

NZD/USD hourly chart

NZD/USD

Overview
Today last price0.6477
Today Daily Change-0.0003
Today Daily Change %-0.05
Today daily open0.648
 
Trends
Daily SMA200.6436
Daily SMA500.6369
Daily SMA1000.6103
Daily SMA2000.6192
 
Levels
Previous Daily High0.6538
Previous Daily Low0.6463
Previous Weekly High0.6526
Previous Weekly Low0.6437
Previous Monthly High0.6531
Previous Monthly Low0.619
Daily Fibonacci 38.2%0.6492
Daily Fibonacci 61.8%0.6509
Daily Pivot Point S10.6449
Daily Pivot Point S20.6419
Daily Pivot Point S30.6374
Daily Pivot Point R10.6525
Daily Pivot Point R20.6569
Daily Pivot Point R30.66

Author

Sagar Dua

Sagar Dua

FXStreet

Sagar Dua is associated with the financial markets from his college days. Along with pursuing post-graduation in Commerce in 2014, he started his markets training with chart analysis.

More from Sagar Dua
Share:

Editor's Picks

EUR/USD hovers above 1.1800 as USD stabilizes

EUR/USD treads water above 1.1800 in the European session on Thursday. The US Dollar stabilizes, following the recent decline fuelled by concerns about the economic fallout from US President Trump's erratic trade policies, capping the pair's upside. All eyes now remain on Lagarde's speech and US-Iran nuclear talks. 

GBP/USD extends recovery to near 20-day EMA as US Dollar weakens

The Pound Sterling holds onto weekly gains around 1.3565 against the US Dollar during the Asian trading session on Thursday. The GBP/USD pair trades firmly as the US Dollar remains under pressure due to uncertainty surrounding the United States trade policy outlook.

Gold clings to gains amid sustained safe-haven flows ahead of US-Iran talks

Gold sticks to its modest intraday gains through the first half of the European session on Thursday, with bulls still awaiting a sustained move and acceptance above the $5,200 mark before placing fresh bets. 

Stellar: Relief bounce fades as bearish undertone persists

Stellar is trading around $0.16 at the time of writing on Thursday after rebounding more than 8% in the previous day. Derivatives data paints a negative picture as XLM’s short bets hit a monthly high while Open Interest continues to decline.

Nvidia delivers another monster earnings report, and forecasts big things to come

It was another monster earnings report from Nvidia for fiscal Q4. Revenues were $68.1bn, smashing estimates of $65bn. Gross profit margin was a healthy 75%, up from 73.5% in the prior quarter, and the outlook for this quarter was monstrous.

Solana strikes key resistance with double-digit gains

Solana trades at $88 at press time on Thursday, after an 11% upswing the previous day within a broader consolidation range of roughly three weeks. Institutional demand for Solana heightens as US spot SOL Exchange Traded Funds record $30 million of inflow on Wednesday.