|

NZD/USD Price Analysis: Stays on the way to 0.6800 on upbeat China PMI

  • NZD/USD seesaws above previously important resistance, recently off intraday low.
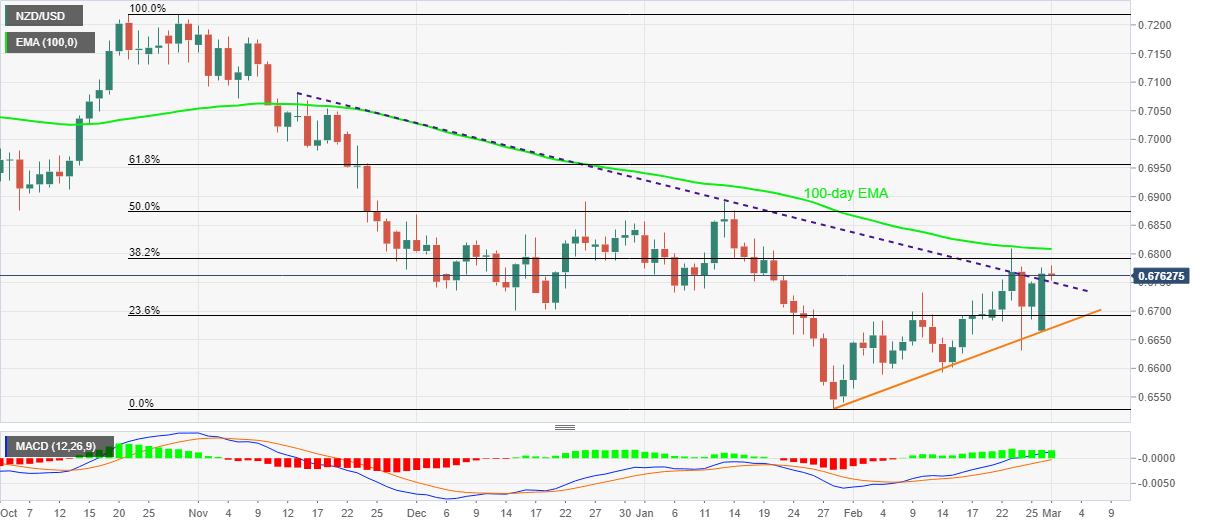
  • Bullish MACD, daily closing beyond 15-week-old trend line hurdle favor buyers to aim for 100-day EMA.
  • China’s NBS Manufacturing and Non-Manufacturing PMIs joined Caixin Manufacturing PMI to portray February’s recovery in key activities.

NZD/USD pares intraday losses a three-day top near 0.6780 during Tuesday’s Asian session.

The kiwi pair offered the first daily closing beyond a downward sloping trend line from mid-November the previous day. The resistance breakout gained support from China’s February PMIs to keep buyers hopeful. However, risk catalysts and the USD rebound seem to test the bulls.

That said, China’s headline NBS Manufacturing PMI for February rose to 50.2 versus 49.9 expected and 50.1 prior. Further, the Non-Manufacturing PMI crossed 51.1 previous readouts with 51.6 figures for the stated month. Additionally, China’s Caixin Manufacturing PMI also rallied to 50.4 compared to 49.3 expected and 49.1 prior.

Given the trend line breakout and firmer data from the key customer NZD/USD prices are likely to stay directed towards the 100-day EMA level of 0.6808.

However, a clear upside break of the stated EMA will enable the bulls to challenge January’s peak of 0.6891.

Alternatively, a daily closing below the stated resistance-turned-support line, near 0.6750 by the press time, could drag the quote toward the 23.6% Fibonacci retracement of October-January downside, near 0.6690.

It should be noted, however, that an upward sloping support line from January 28, close to 0.6670 at the latest, will challenge NZD/USD bears afterward.

NZD/USD: Daily chart

Trend: Further upside expected

Additional important levels

Overview
Today last price0.6765
Today Daily Change0.0000
Today Daily Change %0.00%
Today daily open0.6765
 
Trends
Daily SMA200.6679
Daily SMA500.6729
Daily SMA1000.6852
Daily SMA2000.6943
 
Levels
Previous Daily High0.6777
Previous Daily Low0.6665
Previous Weekly High0.681
Previous Weekly Low0.663
Previous Monthly High0.681
Previous Monthly Low0.6565
Daily Fibonacci 38.2%0.6734
Daily Fibonacci 61.8%0.6708
Daily Pivot Point S10.6694
Daily Pivot Point S20.6623
Daily Pivot Point S30.6582
Daily Pivot Point R10.6807
Daily Pivot Point R20.6848
Daily Pivot Point R30.6919

Author

Anil Panchal

Anil Panchal

FXStreet

Anil Panchal has nearly 15 years of experience in tracking financial markets. With a keen interest in macroeconomics, Anil aptly tracks global news/updates and stays well-informed about the global financial moves and their implications.

More from Anil Panchal
Share:

Markets move fast. We move first.

Orange Juice Newsletter brings you expert driven insights - not headlines. Every day on your inbox.

By subscribing you agree to our Terms and conditions.

Editor's Picks

EUR/USD moves sideways below 1.1800 on Christmas Eve

EUR/USD struggles to find direction and trades in a narrow channel below 1.1800 after posting gains for two consecutive days. Bond and stock markets in the US will open at the usual time and close early on Christmas Eve, allowing the trading action to remain subdued. 

GBP/USD keeps range around 1.3500 amid quiet markets

GBP/USD keeps its range trade intact at around 1.3500 on Wednesday. The Pound Sterling holds the upper hand over the US Dollar amid pre-Christmas light trading as traders move to the sidelines heading into the holiday season. 

Gold retreats from record highs, trades below $4,500

Gold retreats after setting a new record-high above $4,520 earlier in the day and trades in a tight range below $4,500 as trading volumes thin out ahead of the Christmas break. The US Dollar selling bias remains unabated on the back of dovish Fed expectations, which continues to act as a tailwind for the bullion amid persistent geopolitical risks.

Bitcoin slips below $87,000 as ETF outflows intensify, whale participation declines

Bitcoin price continues to trade around $86,770 on Wednesday, after failing to break above the $90,000 resistance. US-listed spot ETFs record an outflow of $188.64 million on Tuesday, marking the fourth consecutive day of withdrawals.

Economic outlook 2026-2027 in advanced countries: Solidity test

After a year marked by global economic resilience and ending on a note of optimism, 2026 looks promising and could be a year of solid economic performance. In our baseline scenario, we expect most of the supportive factors at work in 2025 to continue to play a role in 2026.

Avalanche struggles near $12 as Grayscale files updated form for ETF

Avalanche trades close to $12 by press time on Wednesday, extending the nearly 2% drop from the previous day. Grayscale filed an updated form to convert its Avalanche-focused Trust into an ETF with the US Securities and Exchange Commission.