|

NZD/USD Price Analysis: Retreats towards 0.5920 on softer NZ data, US Dollar rebound

  • NZD/USD pares the biggest daily gains in six weeks within fortnight-old descending trend channel.
  • Disappointing prints of New Zealand Building Permits for July recall Kiwi bears after two-day absence.
  • Previous resistance line from late July lures Kiwi sellers but bullish MACD signals keep buyers hopeful.
  • Key SMAs, bearish chart formation challenge bulls ahead of top-tier US data.

NZD/USD takes offers to refresh the intraday low near 0.5945 during early Wednesday morning in Europe. In doing so, the Kiwi pair justifies the downbeat New Zealand (NZ) housing data, as well as portrays the market’s cautious mood ahead of the top-tier US data.

New Zealand Building Permits for July marked a notable slump of 5.2% MoM versus 0.2% expected and 3.4% prior (revised from 3.5%).

It’s worth noting that the US ADP Employment Change, the final readings of the US second quarter (Q2) Gross Domestic Product (GDP) and the Personal Consumption Expenditure (PCE) are on the calendar and prod the sentiment, as well as the NZD/USD price. With this, the US Dollar Index (DXY) also licks its wounds around 103.60 after falling the most in six weeks the previous day.

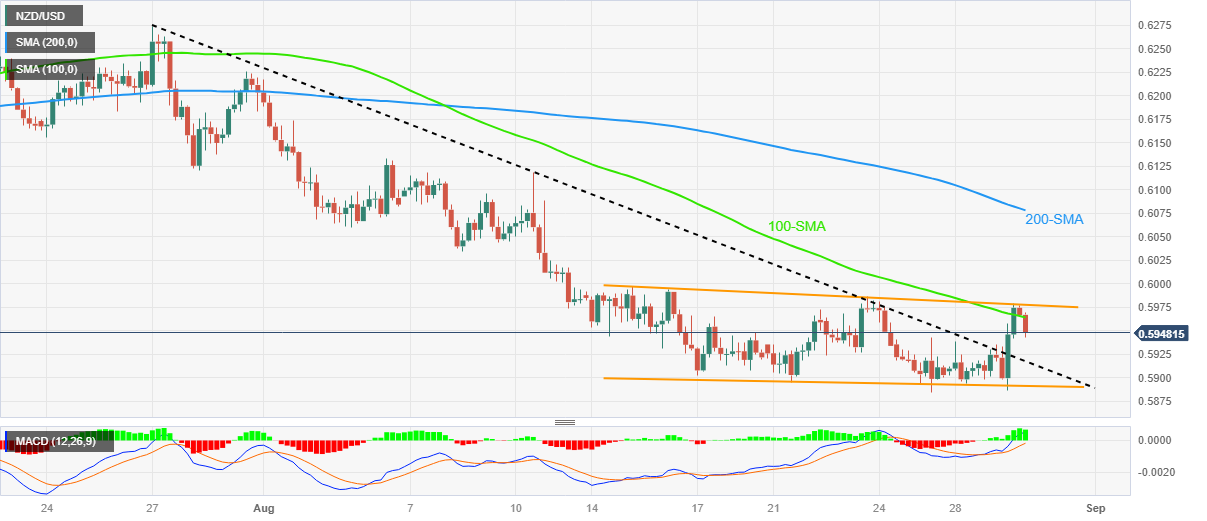
Technically, a retreat from the top-line of a two-week-old bearish channel, as well as a downside break of the 100-SMA, favors the NZD/USD sellers to aim for the previous resistance line stretched from late July, close to 0.5920 at the latest.

However, the bullish MACD signals and the bottom line of the stated channel, near 0.5890 by the press time, challenge further downside of the Kiwi pair past 0.5920.

Meanwhile, the 100-SMA and the channel’s top-line, respectively near 0.5965 and 0.5980, guard immediate recovery of the NZD/USD pair.

Following that, a run-up towards the 200-SMA hurdle of around 0.6080 can’t be ruled out.

NZD/USD: Four-hour chart

Trend: Limited downside expected

Additional important levels

Overview
Today last price0.5948
Today Daily Change-0.0024
Today Daily Change %-0.40%
Today daily open0.5972
 
Trends
Daily SMA200.5987
Daily SMA500.6115
Daily SMA1000.6146
Daily SMA2000.6225
 
Levels
Previous Daily High0.5979
Previous Daily Low0.5887
Previous Weekly High0.5987
Previous Weekly Low0.5885
Previous Monthly High0.6413
Previous Monthly Low0.612
Daily Fibonacci 38.2%0.5944
Daily Fibonacci 61.8%0.5922
Daily Pivot Point S10.5913
Daily Pivot Point S20.5854
Daily Pivot Point S30.5821
Daily Pivot Point R10.6005
Daily Pivot Point R20.6038
Daily Pivot Point R30.6097

Author

Anil Panchal

Anil Panchal

FXStreet

Anil Panchal has nearly 15 years of experience in tracking financial markets. With a keen interest in macroeconomics, Anil aptly tracks global news/updates and stays well-informed about the global financial moves and their implications.

More from Anil Panchal
Share:

Markets move fast. We move first.

Orange Juice Newsletter brings you expert driven insights - not headlines. Every day on your inbox.

By subscribing you agree to our Terms and conditions.

Editor's Picks

EUR/USD ticks lower following the release of FOMC Minutes

The US Dollar found some near-term demand following the release of the FOMC meeting minutes, with the EUR/USD pair currently piercing the 1.1750 threshold. The document showed officials are still willing to trim interest rates. Meanwhile, thinned holiday trading keeps major pairs confined to familiar levels.

GBP/USD remains sub- 1.3500, remains in the red

The GBP/USD lost traction early in the American session, maintaining the sour tone and trading around 1.3460 following the release of the FOMC meeting minutes. Trading conditions remain thin ahead of the New Year holiday, limiting the pair's volatility.

Gold stable above $4,350 as the year comes to an end

Gold price got to recover some modest ground on Tuesday, holding on to intraday gains and changing hands at $4,360 a troy ounce in the American afternoon. The bright metal showed no reaction to the release of the FOMC December meeting minutes.

Ethereum: ETH holds above $2,900 despite rising selling activity

Ethereum (ETH) held the $2,900 level despite seeing increased selling pressure over the past week. The Exchange Netflow metric showed deposits outweighed withdrawals by about 400K ETH. The high value suggests rising selling activity amid the holiday season.

Economic outlook 2026-2027 in advanced countries: Solidity test

After a year marked by global economic resilience and ending on a note of optimism, 2026 looks promising and could be a year of solid economic performance. In our baseline scenario, we expect most of the supportive factors at work in 2025 to continue to play a role in 2026.

Crypto market outlook for 2026

Year 2025 was volatile, as crypto often is.  Among positive catalysts were favourable regulatory changes in the U.S., rise of Digital Asset Treasuries (DAT), adoption of AI and tokenization of Real-World-Assets (RWA).