NZD/USD Price Analysis: RBNZ in focus, key levels and market structure to watch
- NZD/USD is holding in a tight range into the RBNZ with breakout points above 0.6750 and below 0.6730 eyed.
- The longer-term charts are bearish, so the RBNZ will need to surprise if the bulls are to stay in control.

NZD/USD is the focus and a 25bp rate hike should reinforce NZD's carry status against the low-yielders, while the prospects of a 50bp hike increase would be an added benefit and will be expected to pole volt 0.6750.
The following is an analysis of the longer-term charts and the near term from an hourly perspective heading into the event.
NZD/USD weekly chart
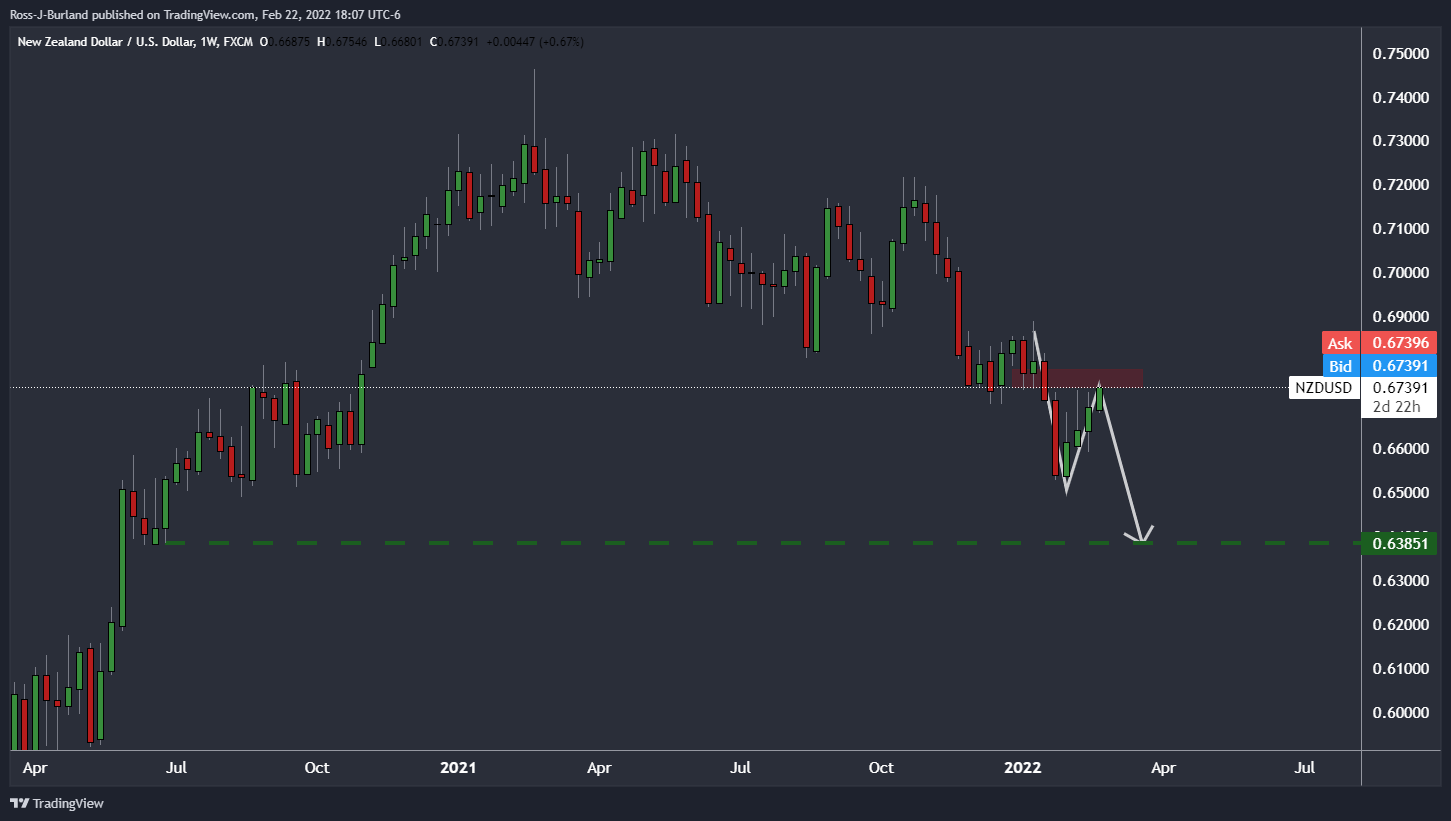
The weekly chart is bearish while below the M-formation's neckline resistance between 0.6730 and the 0.6770s. An extension to the downside could be on the cards for the weeks ahead with 0.6385 eyed as a -61.8% Fibo target and the confluence with prior lows.
NZD/USD daily chart
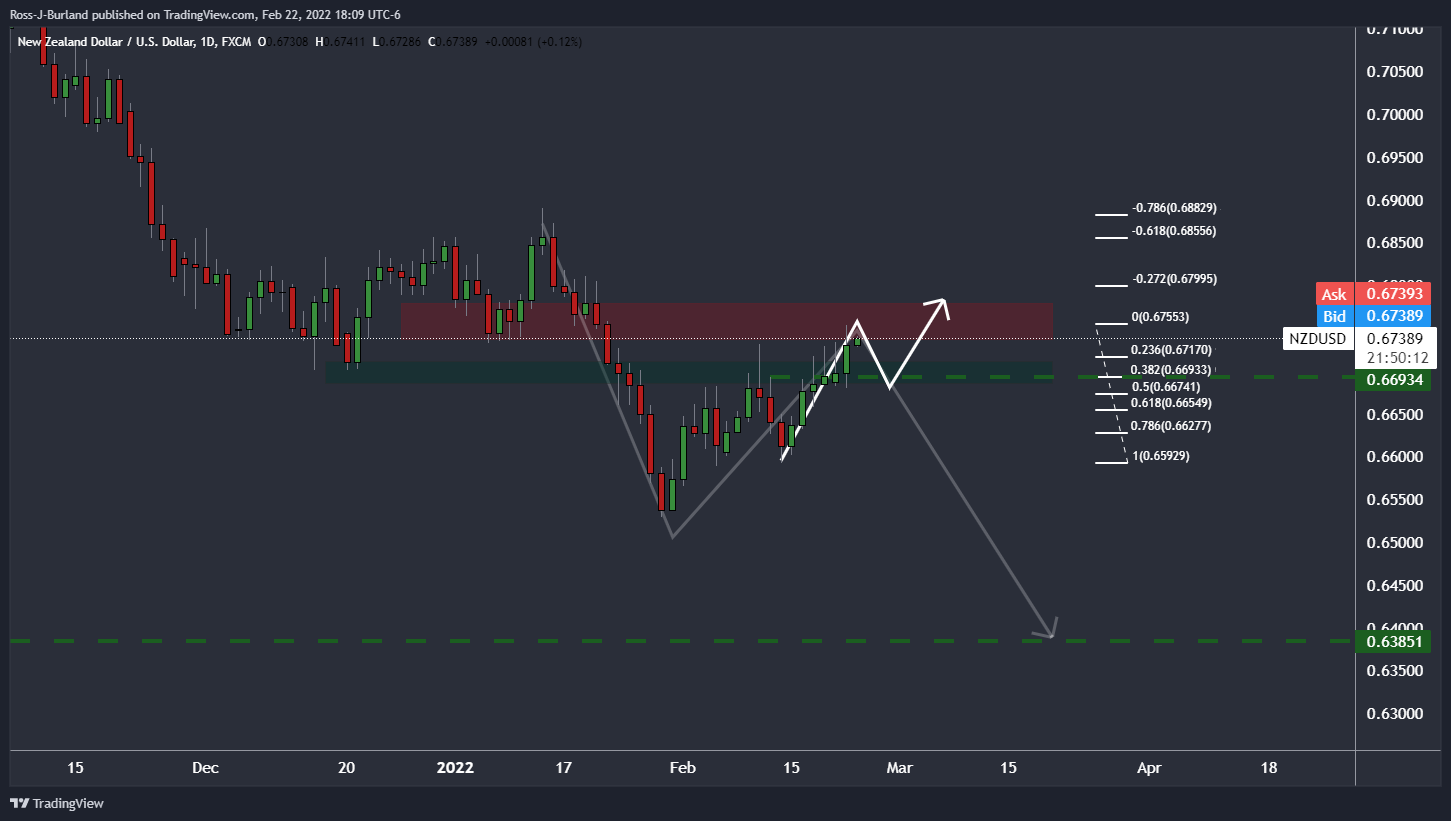
The daily chart shows the price eating its way into resistance but is overextended and could be due for a correction in coming sessions. The 38.2% Fibo meets with prior structure near 0.6690. If this were to hold, then the bulls could seek to engage at a discount and target a higher test in the weekly resistance towards the 0.67790s.
NZD/USD H1 chart
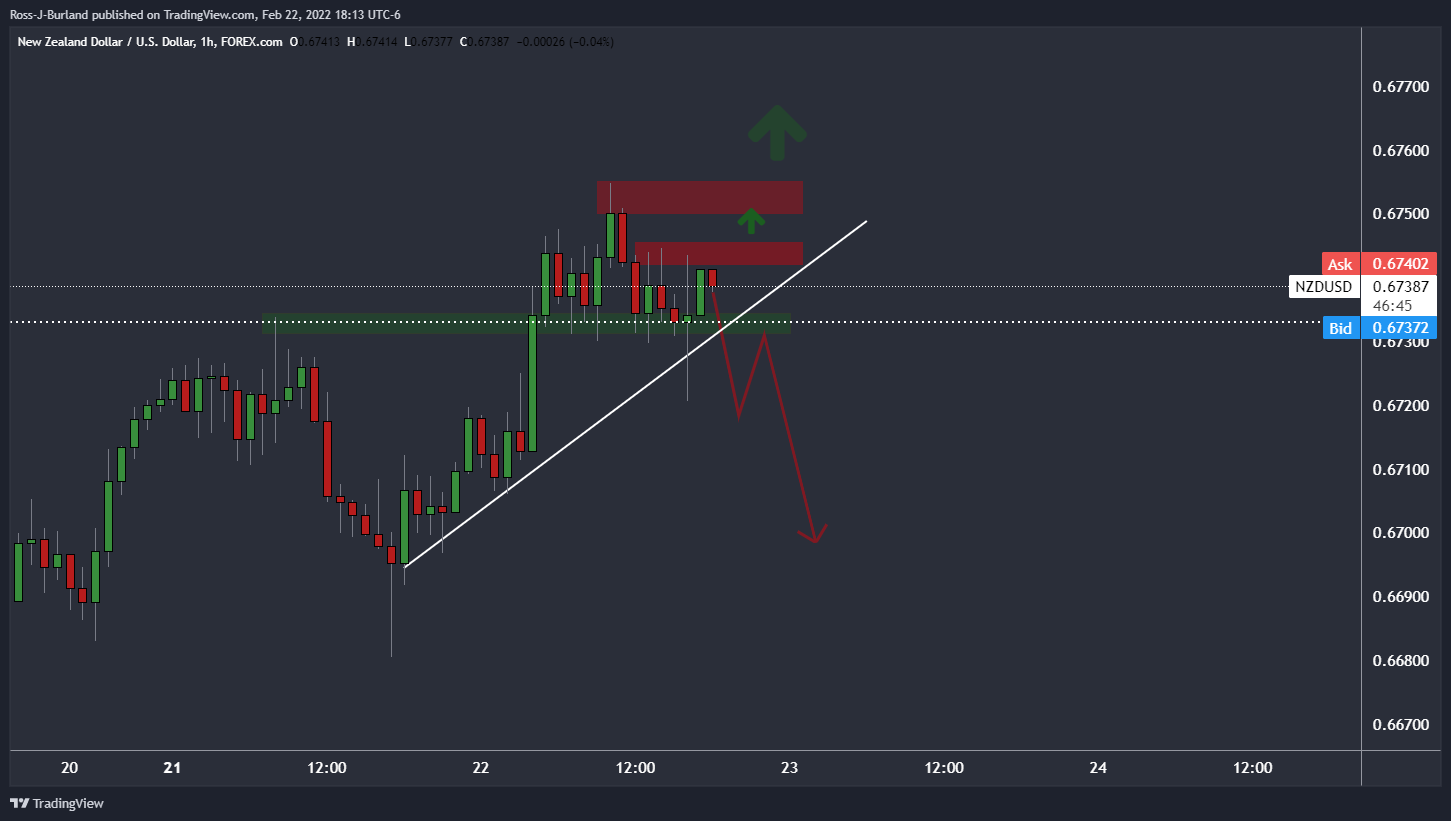
Should there be an uber hawkish surprise from the RBNZ, then a break of 0.6750 opens risk for a deeper test of the weekly resistance in the 0.6770s.
Author

Ross J Burland
FXStreet
Ross J Burland, born in England, UK, is a sportsman at heart. He played Rugby and Judo for his county, Kent and the South East of England Rugby team.


