NZD/USD Price Analysis: Pullback remains elusive beyond 0.6230


  • NZD/USD retreats from a four-month high, snaps three-day uptrend after refreshing multi-day top.
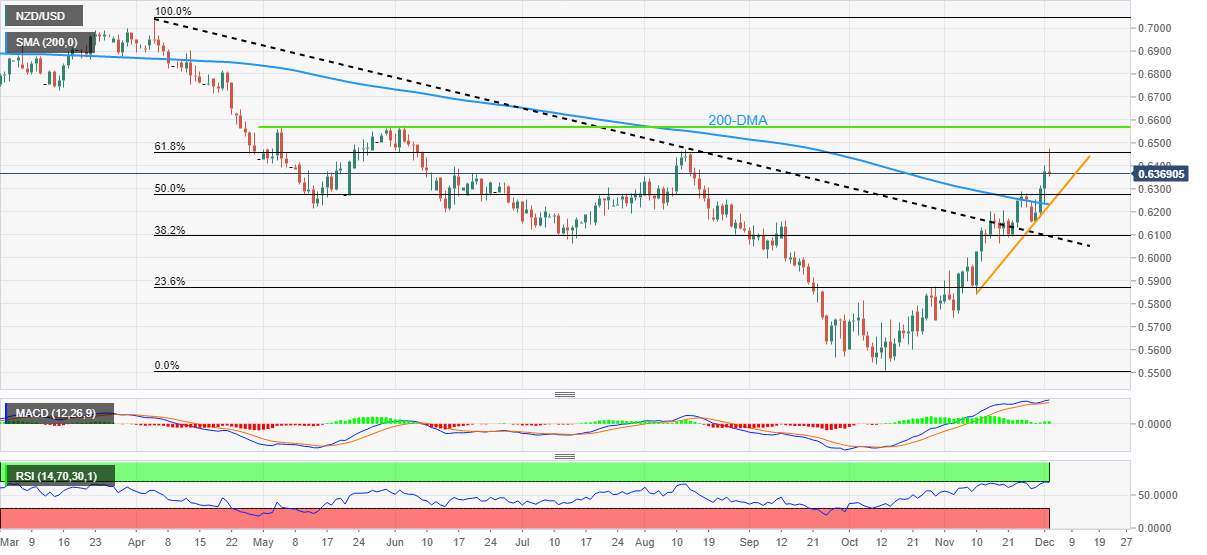
  • 61.8% Fibonacci retracement level probes buyers amid overbought RSI.
  • Convergence of 200-DMA, monthly support line restricts immediate downside.

NZD/USD pares recent gains at the highest levels since early August as it prints mild losses around 0.6365 during early Friday.

In doing so, the Kiwi pair retreats from the 61.8% Fibonacci retracement level of the pair’s April-October moves, near 0.6460, amid the overbought RSI (14).

That said, the 50% Fibonacci retracement level near 0.6275 lures intraday sellers before highlighting the 0.6230 support confluence, encompassing the 200-DMA and a one-month-old ascending trend line.

Should the quote remains bearish past 0.6230, the odds of witnessing a south-run towards the previous resistance line from early April, near 0.6090, can’t be ruled out.

Alternatively, a daily closing beyond the 61.8% Fibonacci retracement level surrounding 0.6460, also known as the golden ratio, becomes necessary for the NZD/USD buyer’s return.

Following that, a horizontal area around 0.6570 including the tops marked in May and June will be crucial to watch as a break which could give a free hand to the bulls targeting March’s low near 0.6730.

Overall, NZD/USD is likely to decline further but the downside appears limited.

NZD/USD: Daily chart

Trend: Limited downside expected

Additional important levels

Overview
Today last price 0.6368
Today Daily Change -0.0006
Today Daily Change % -0.09%
Today daily open 0.6374
 
Trends
Daily SMA20 0.6131
Daily SMA50 0.5873
Daily SMA100 0.6025
Daily SMA200 0.6292
 
Levels
Previous Daily High 0.64
Previous Daily Low 0.6233
Previous Weekly High 0.629
Previous Weekly Low 0.6087
Previous Monthly High 0.6314
Previous Monthly Low 0.5741
Daily Fibonacci 38.2% 0.6336
Daily Fibonacci 61.8% 0.6297
Daily Pivot Point S1 0.6271
Daily Pivot Point S2 0.6168
Daily Pivot Point S3 0.6103
Daily Pivot Point R1 0.6439
Daily Pivot Point R2 0.6503
Daily Pivot Point R3 0.6606


Share: Feed news

Information on these pages contains forward-looking statements that involve risks and uncertainties. Markets and instruments profiled on this page are for informational purposes only and should not in any way come across as a recommendation to buy or sell in these assets. You should do your own thorough research before making any investment decisions. FXStreet does not in any way guarantee that this information is free from mistakes, errors, or material misstatements. It also does not guarantee that this information is of a timely nature. Investing in Open Markets involves a great deal of risk, including the loss of all or a portion of your investment, as well as emotional distress. All risks, losses and costs associated with investing, including total loss of principal, are your responsibility. The views and opinions expressed in this article are those of the authors and do not necessarily reflect the official policy or position of FXStreet nor its advertisers. The author will not be held responsible for information that is found at the end of links posted on this page.

If not otherwise explicitly mentioned in the body of the article, at the time of writing, the author has no position in any stock mentioned in this article and no business relationship with any company mentioned. The author has not received compensation for writing this article, other than from FXStreet.

FXStreet and the author do not provide personalized recommendations. The author makes no representations as to the accuracy, completeness, or suitability of this information. FXStreet and the author will not be liable for any errors, omissions or any losses, injuries or damages arising from this information and its display or use. Errors and omissions excepted.

The author and FXStreet are not registered investment advisors and nothing in this article is intended to be investment advice.

Recommended content


Recommended content

Editors’ Picks

EUR/USD clings to daily gains above 1.0650

EUR/USD clings to daily gains above 1.0650

EUR/USD gained traction and turned positive on the day above 1.0650. The improvement seen in risk mood following the earlier flight to safety weighs on the US Dollar ahead of the weekend and helps the pair push higher.

EUR/USD News

GBP/USD recovers toward 1.2450 after UK Retail Sales data

GBP/USD recovers toward 1.2450 after UK Retail Sales data

GBP/USD reversed its direction and advanced to the 1.2450 area after touching a fresh multi-month low below 1.2400 in the Asian session. The positive shift seen in risk mood on easing fears over a deepening Iran-Israel conflict supports the pair.

GBP/USD News

Gold price defends gains below $2,400 as geopolitical risks linger

Gold price defends gains below $2,400 as geopolitical risks linger

Gold price is trading below $2,400 in European trading on Friday, holding its retreat from a fresh five-day high of $2,418. Despite the pullback, Gold price remains on track to book the fifth weekly gain in a row, supported by lingering Middle East geopolitical risks.

Gold News

Bitcoin Weekly Forecast: BTC post-halving rally could be partially priced in Premium

Bitcoin Weekly Forecast: BTC post-halving rally could be partially priced in

Bitcoin price shows no signs of directional bias while it holds above  $60,000. The fourth BTC halving is partially priced in, according to Deutsche Bank’s research. 

Read more

Geopolitics once again take centre stage, as UK Retail Sales wither

Geopolitics once again take centre stage, as UK Retail Sales wither

Nearly a week to the day when Iran sent drones and missiles into Israel, Israel has retaliated and sent a missile into Iran. The initial reports caused a large uptick in the oil price.

Read more

Forex MAJORS

Cryptocurrencies

Signatures