|

NZD/USD Price Analysis: Pair saw a volatile session, high near 20-day SMA then retreated

  • NZD/USD pair traded volatile during Friday's session, clearing all of its daily gains.
  • Pair initially soared to a high around 0.5970 near the 20-day SMA before erasing all the gains towards 0.5850.
  • The RSI signaled that buying pressure recovered as it neared the oversold area with a rise in slope.

The NZD/USD saw a volatile session on Friday, initially soaring to a high around 0.5970 near the 20-day Simple Moving Average (SMA) before erasing all the gains towards 0.5850. The pair mildly rose to 0.5855, indicating that the bulls have limited power and that the bears continue in command but a correction is on the horizon as indicators are near oversold levels.

The technical indicators currently depict a mixed outlook for the NZD/USD pair. The Relative Strength Index (RSI) suggests that buying pressure is recovering as it is approaching the oversold area and its slope is rising sharply. Conversely, the Moving Average Convergence Divergence (MACD) indicates that selling pressure is flat, as evidenced by the flat and red histogram. Despite these conflicting signals, the overall outlook remains tilted in favor of the bears.

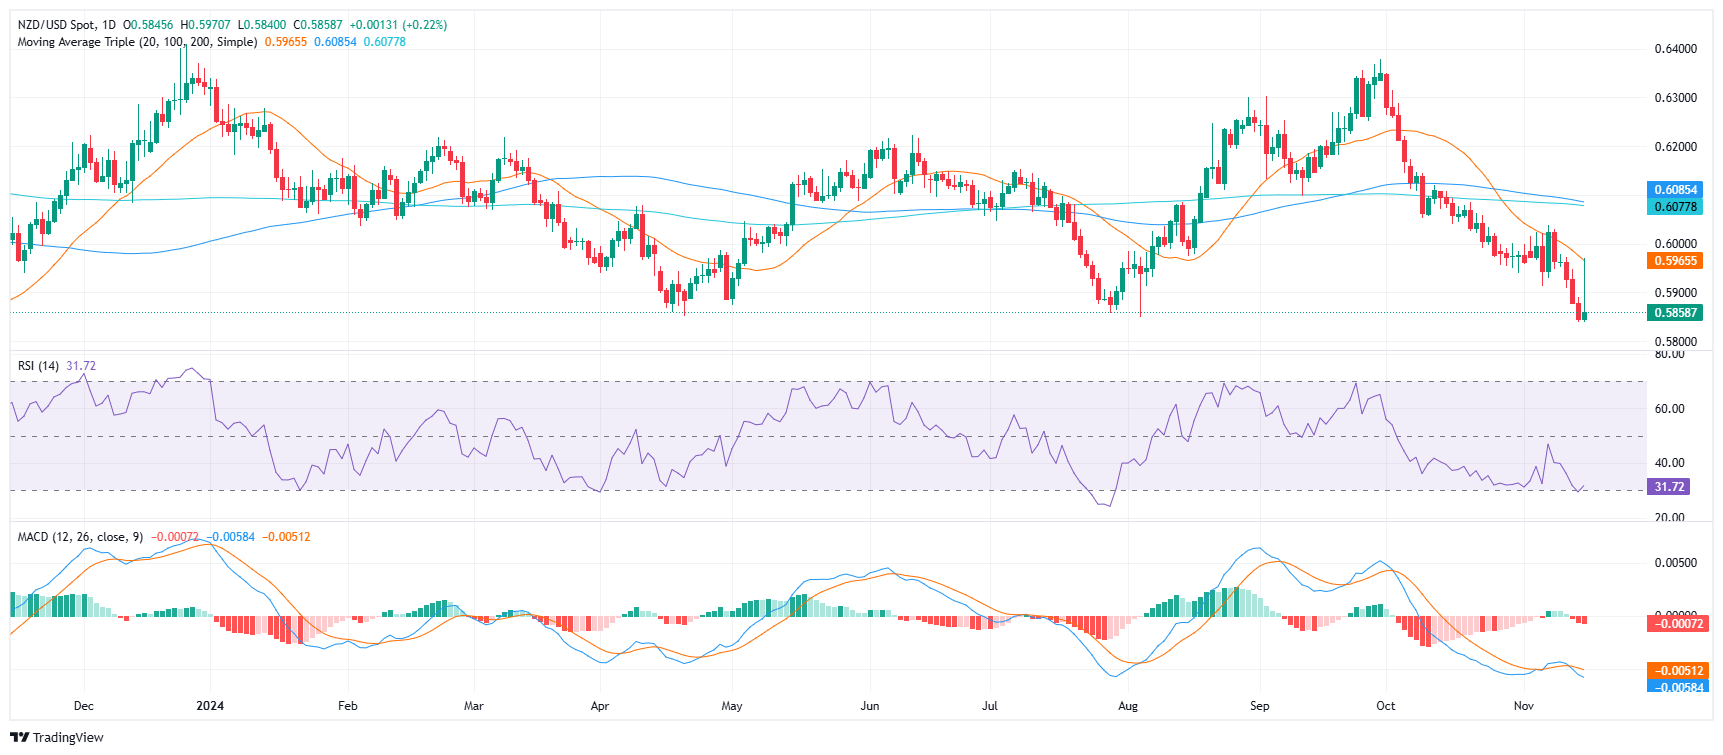
Support levels can be found at 0.5900, 0.5850, and 0.5800, while resistance levels lie at 0.5950, 0.6000, and 0.6050.

NZD/USD daily chart

Author

Patricio Martín

Patricio is an economist from Argentina passionate about global finance and understanding the daily movements of the markets.

More from Patricio Martín
Share:

Editor's Picks

EUR/USD keeps the offered stance just above 1.1700

EUR/USD is coming under heavy selling pressure in what has been a rather grim start to the new trading week, with the pair now trading close to the 1.1700 support area as the US Dollar stages a solid rebound. The prevailing flight to safety mood continues to favour the Greenback, as investors react to the escalating conflict in the Middle East and trim risk exposure across the board.

GBP/USD hits new yearly lows near 1.3300

GBP/USD adds to the recent bearish tone, approaching to the key 1.3300 support to reach fresh YTD troughs against the backdrop of the robust performance of the US Dollar. Indeed, Cable’s decline comes amid the firm demand for the safe-haven space in the wake of the US and Israel attacks to Iran.

Gold battles to retain the positive momentum

Gold now surrenders part of the earlier advance past the $5,400 mark per troy ounce at the beginning of the week. Indeed, the precious metal’s strong uptick remains fuelled by increasing geopolitical tensions in the Middle East amid the intense demand for safer assets.

Bitcoin on brink of breakdown amid US-Iran war

Bitcoin (BTC) remains under pressure near the key support level of $65,700. Trading at $66,400 at the time of writing on Monday, a breakdown below this critical level would suggest a deeper correction ahead.

The Fed is finally talking about AI – Here's why it matters for the US Dollar

AI is moving from earnings calls into the heart of monetary policy discussions, forcing Federal Reserve officials to confront a new question: How to act if AI reshapes inflation, employment and interest rates at the same time?

Grass 20% bullish breakout defies broader market weakness

Grass (GRASS) is edging up above $0.30 at the time of writing on Monday. The token’s notable 20% intraday surge stands out amid heightened volatility in the broader crypto market.