|

NZD/USD Price Analysis: Pair falls to 0.5800 after strong rejection at 20-day SMA

  • NZD/USD declines on Tuesday, retreating to 0.5800 after failing to reclaim the 20-day SMA.
  • Pair faces strong rejection at the 20-day SMA, falling to fresh lows not seen since November 2023.
  • RSI declines sharply in negative territory, while MACD histogram shows weakening bullish momentum with decreasing green bars.

The NZD/USD pair faced renewed selling pressure on Tuesday, dropping by 1.14% to 0.5800 after a failed attempt to reclaim the 20-day Simple Moving Average (SMA). The rejection at this key resistance level highlights the pair's inability to reverse its bearish trend, pushing it to fresh lows not seen since November 2023.

Technical indicators reinforce the bearish sentiment. The Relative Strength Index (RSI) has declined sharply to 39, remaining in negative territory and signaling intensifying selling pressure. Similarly, the Moving Average Convergence Divergence (MACD) histogram prints decreasing green bars, suggesting weakening bullish momentum and a lack of recovery signals.

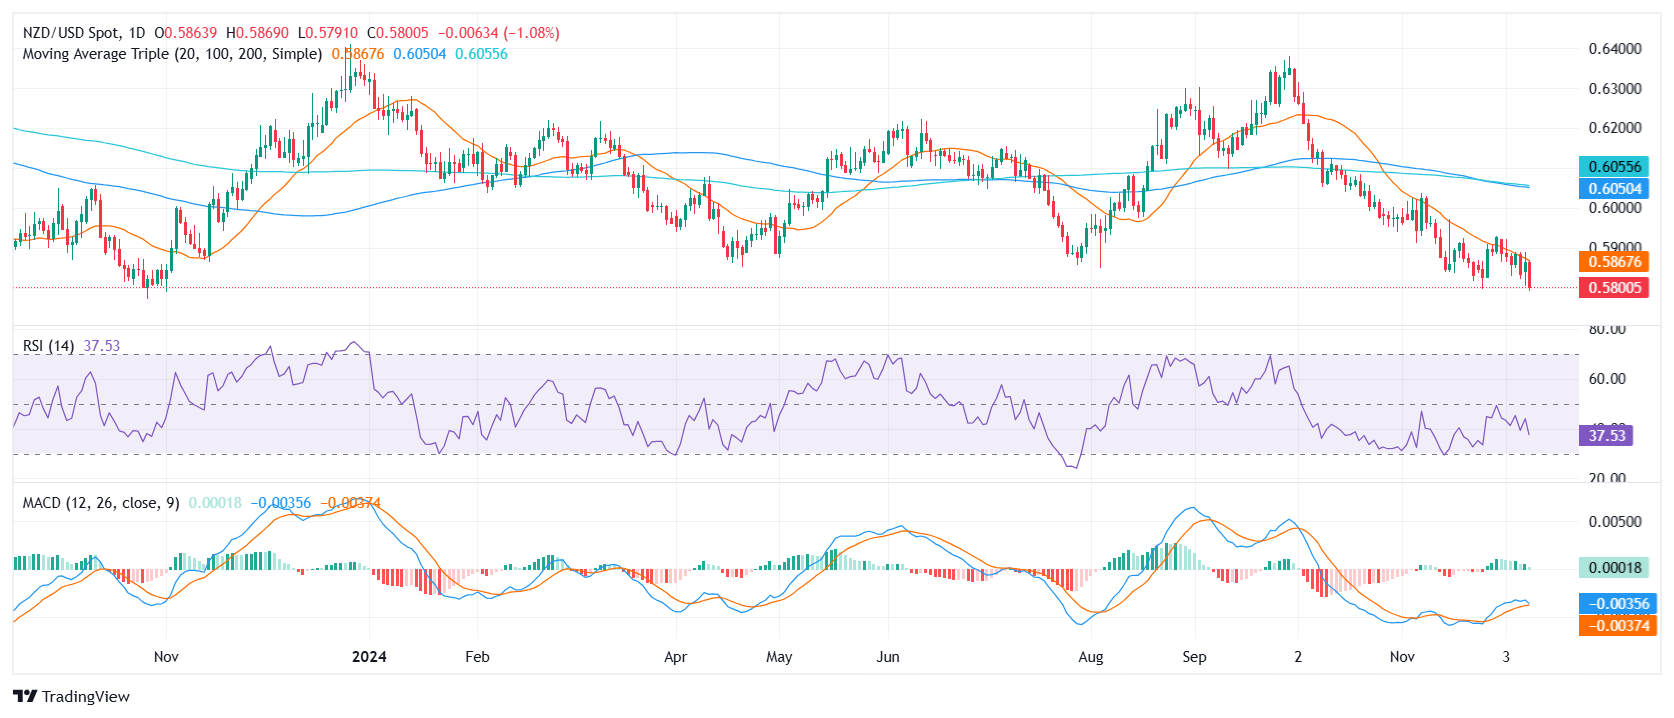
With the pair now trading near the critical 0.5800 psychological support level, the downside risks remain elevated. A break below this level could pave the way for further declines, potentially targeting the 0.5770-0.5750 range. On the upside, the 20-day SMA at 0.5890 remains the key barrier, with a decisive break above it needed to shift the outlook back to neutral or bullish.

NZD/USD daily chart

Author

Patricio Martín

Patricio is an economist from Argentina passionate about global finance and understanding the daily movements of the markets.

More from Patricio Martín
Share:

Editor's Picks

EUR/USD challenges 1.1700, six-week lows

EUR/USD remains under heavy downside pressire in quite a dfrreadful start to the new trading week, putting the 1.1700 support to the test amid the marked rebound in the US Dollar. The flight-so-safety environment continues to support the Greenback following the escalating conflict in the Middle East.

GBP/USD hits new yearly lows near 1.3300

GBP/USD adds to the recent bearish tone, approaching to the key 1.3300 support to reach fresh YTD troughs against the backdrop of the robust performance of the US Dollar. Indeed, Cable’s decline comes amid the firm demand for the safe-haven space in the wake of the US and Israel attacks to Iran.

Gold shifts its attention to $5,600 on fligh-to-safety mood

Gold climbs to levels last seen in late January past the $5,400 mark per troy ounce on Monday. The yellow metal’s strong uptick remains fuelled by incresing geopolitical tensions in the Middle East and the consequent demand for safer assets.

Bitcoin on brink of breakdown amid US-Iran war

Bitcoin (BTC) remains under pressure near the key support level of $65,700. Trading at $66,400 at the time of writing on Monday, a breakdown below this critical level would suggest a deeper correction ahead.

The week ahead: Conflict in the Middle East jolts markets

Events in the Middle East are obviously dominating financial markets this morning. The Brent crude oil price is extending gains and is higher by more than 8%, stock futures are pointing lower and the gold price is higher by more than 2%. 

Pi Network Price Forecast: Core team offloads supply, weighing on PI recovery

Pi Network  hovers below $0.1700, broadly steady at press time on Monday, attempting a recovery after a 2% loss the previous day. Sunday’s decline aligned with nearly 49 million PI tokens offloaded by the Pi Foundation, implying a spike in supply pressure that capped the prevailing four-day recovery.