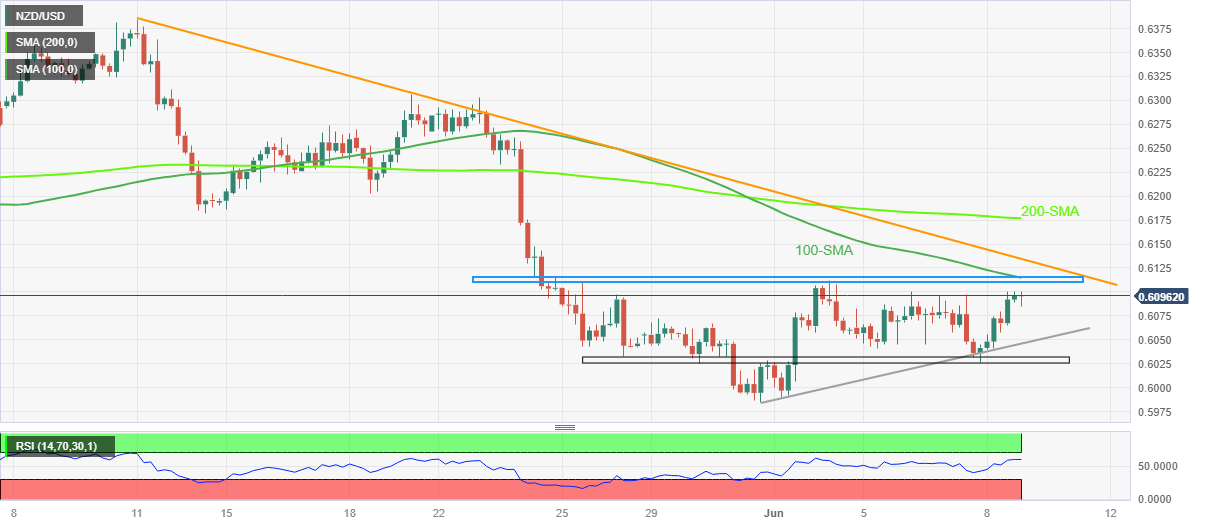
NZD/USD Price Analysis: Multiple hurdles prod Kiwi bulls, focus on 200-SMA, China inflation


  • NZD/USD approaches short-term key hurdle after rising the most in two months the previous day.
  • 12-day-old horizontal resistance zone, descending trend line from early May challenge Kiwi bulls before 200-SMA.
  • Sellers may wait for weekly support break for fresh entry.
  • China’s CPI, PPI for May can join upbeat RSI to favor bulls ahead of next week’s Fed meeting.

NZD/USD bulls are yet to retake control, despite the most in two months the previous day, as multiple key upside hurdles stand tall to challenge the latest advances ahead of the key China inflation data on early Friday. With this, the Kiwi pair dribbles around 0.6100 by the press time.

It should be noted that the quote’s sustained trading beyond the one-week-old ascending support line and upbeat RSI (14) line, not overbought, keeps the buyers hopeful.

However, a fortnight-long horizontal resistance area, which also comprises the 100-SMA hurdle, restricts the immediate upside of the NZD/USD pair around 0.6110-15.

Following that, a one-month-old descending trend line, close to 0.6135 by the press time, could challenge the Kiwi buyers ahead of directing them to the 200-SMA resistance of around 0.6180 at the latest.

In a case where the NZD/USD remains firmer past 0.6180, the odds of witnessing a rally beyond 0.6200 can’t be ruled out.

On the contrary, the aforementioned one-week-old rising trend line, near 0.6050 at the latest, restricts the immediate downside of the NZD/USD pair.

Even if the pair breaks the 0.6050 support, an area comprising multiple levels marked since May 26, surrounding .6025-30, can act as the last defense of the NZD/USD bulls.

Overall, the NZD/USD bulls are up for retaking control but they need validation from the 200-SMA and China’s inflation gauges for May, namely the Consumer Price Index (CPI) and Producer Price Index (PPI).

NZD/USD: Four-hour chart

Trend: Further upside expected

Additional important levels

Overview
Today last price 0.6095
Today Daily Change 0.0058
Today Daily Change % 0.96%
Today daily open 0.6037
 
Trends
Daily SMA20 0.6138
Daily SMA50 0.6194
Daily SMA100 0.624
Daily SMA200 0.6149
 
Levels
Previous Daily High 0.6097
Previous Daily Low 0.6031
Previous Weekly High 0.6112
Previous Weekly Low 0.5985
Previous Monthly High 0.6385
Previous Monthly Low 0.5985
Daily Fibonacci 38.2% 0.6056
Daily Fibonacci 61.8% 0.6072
Daily Pivot Point S1 0.6013
Daily Pivot Point S2 0.5989
Daily Pivot Point S3 0.5947
Daily Pivot Point R1 0.6079
Daily Pivot Point R2 0.6121
Daily Pivot Point R3 0.6145


Share: Feed news

Information on these pages contains forward-looking statements that involve risks and uncertainties. Markets and instruments profiled on this page are for informational purposes only and should not in any way come across as a recommendation to buy or sell in these assets. You should do your own thorough research before making any investment decisions. FXStreet does not in any way guarantee that this information is free from mistakes, errors, or material misstatements. It also does not guarantee that this information is of a timely nature. Investing in Open Markets involves a great deal of risk, including the loss of all or a portion of your investment, as well as emotional distress. All risks, losses and costs associated with investing, including total loss of principal, are your responsibility. The views and opinions expressed in this article are those of the authors and do not necessarily reflect the official policy or position of FXStreet nor its advertisers. The author will not be held responsible for information that is found at the end of links posted on this page.

If not otherwise explicitly mentioned in the body of the article, at the time of writing, the author has no position in any stock mentioned in this article and no business relationship with any company mentioned. The author has not received compensation for writing this article, other than from FXStreet.

FXStreet and the author do not provide personalized recommendations. The author makes no representations as to the accuracy, completeness, or suitability of this information. FXStreet and the author will not be liable for any errors, omissions or any losses, injuries or damages arising from this information and its display or use. Errors and omissions excepted.

The author and FXStreet are not registered investment advisors and nothing in this article is intended to be investment advice.

Recommended content


Recommended content

Editors’ Picks

AUD/USD hovers around 0.6500 amid light trading, ahead of US GDP

AUD/USD hovers around 0.6500 amid light trading, ahead of US GDP

AUD/USD is trading close to 0.6500 in Asian trading on Thursday, lacking a clear directional impetus amid an Anzac Day holiday in Australia. Meanwhile, traders stay cautious due ti risk-aversion and ahead of the key US Q1 GDP release. 

AUD/USD News

USD/JPY finds its highest bids since 1990, near 155.50

USD/JPY finds its highest bids since 1990, near 155.50

USD/JPY keeps breaking into its highest chart territory since June of 1990 early Thursday, testing 155.50 for the first time in 34 years as the Japanese Yen remains vulnerable, despite looming Japanese intervention risks. Focus shifts to Thursday's US GDP report and the BoJ decision on Friday. 

USD/JPY News

Gold price treads water near $2,320, awaits US GDP data

Gold price treads water near $2,320, awaits US GDP data

Gold price recovers losses but keeps its range near $2,320 early Thursday. Renewed weakness in the US Dollar and the US Treasury yields allow Gold buyers to breathe a sigh of relief. Gold price stays vulnerable amid Middle East de-escalation, awaiting US Q1 GDP data. 

Gold News

Injective price weakness persists despite over 5.9 million INJ tokens burned

Injective price weakness persists despite over 5.9 million INJ tokens burned

Injective price is trading with a bearish bias, stuck in the lower section of the market range. The bearish outlook abounds despite the network's deflationary efforts to pump the price. Coupled with broader market gloom, INJ token’s doomed days may not be over yet.

Read more

Meta Platforms Earnings: META sinks 10% on lower Q2 revenue guidance Premium

Meta Platforms Earnings: META sinks 10% on lower Q2 revenue guidance

This must be "opposites" week. While Doppelganger Tesla rode horrible misses on Tuesday to a double-digit rally, Meta Platforms produced impressive beats above Wall Street consensus after the close on Wednesday, only to watch the share price collapse by nearly 10%.

Read more

Forex MAJORS

Cryptocurrencies

Signatures