|

NZD/USD Price Analysis: Kiwi slips as moving average cluster offers key support

  • NZD/USD was seen around the 0.5730 zone, posting modest daily losses ahead of the Asian session.
  • The pair is testing a key confluence of the 20 and 100-day moving averages, with downside risks emerging below this area.

During Friday’s session ahead of the Asian open, NZD/USD declined modestly and was last seen hovering around the 0.5730 area. The pair remains under pressure after sellers stepped in earlier in the day, with price action now centered around the convergence of the 20-day and 100-day Simple Moving Averages—a key technical juncture for the short-term outlook.

The Relative Strength Index (RSI) has sharply dropped but still holds in the positive region, hovering just above the 50 mark, suggesting that bullish momentum is fading. The Moving Average Convergence Divergence (MACD) remains above zero, but its histogram is printing smaller green bars, reflecting weakening upside pressure.

Technically, a clean break below the 0.5730 support area—where the 20-day and 100-day SMAs intersect—could expose the pair to a deeper pullback toward 0.5680 and then the 0.5620 zone. On the flip side, if buyers manage to defend this support cluster, recovery attempts could target resistance around 0.5780 and 0.5820 next.
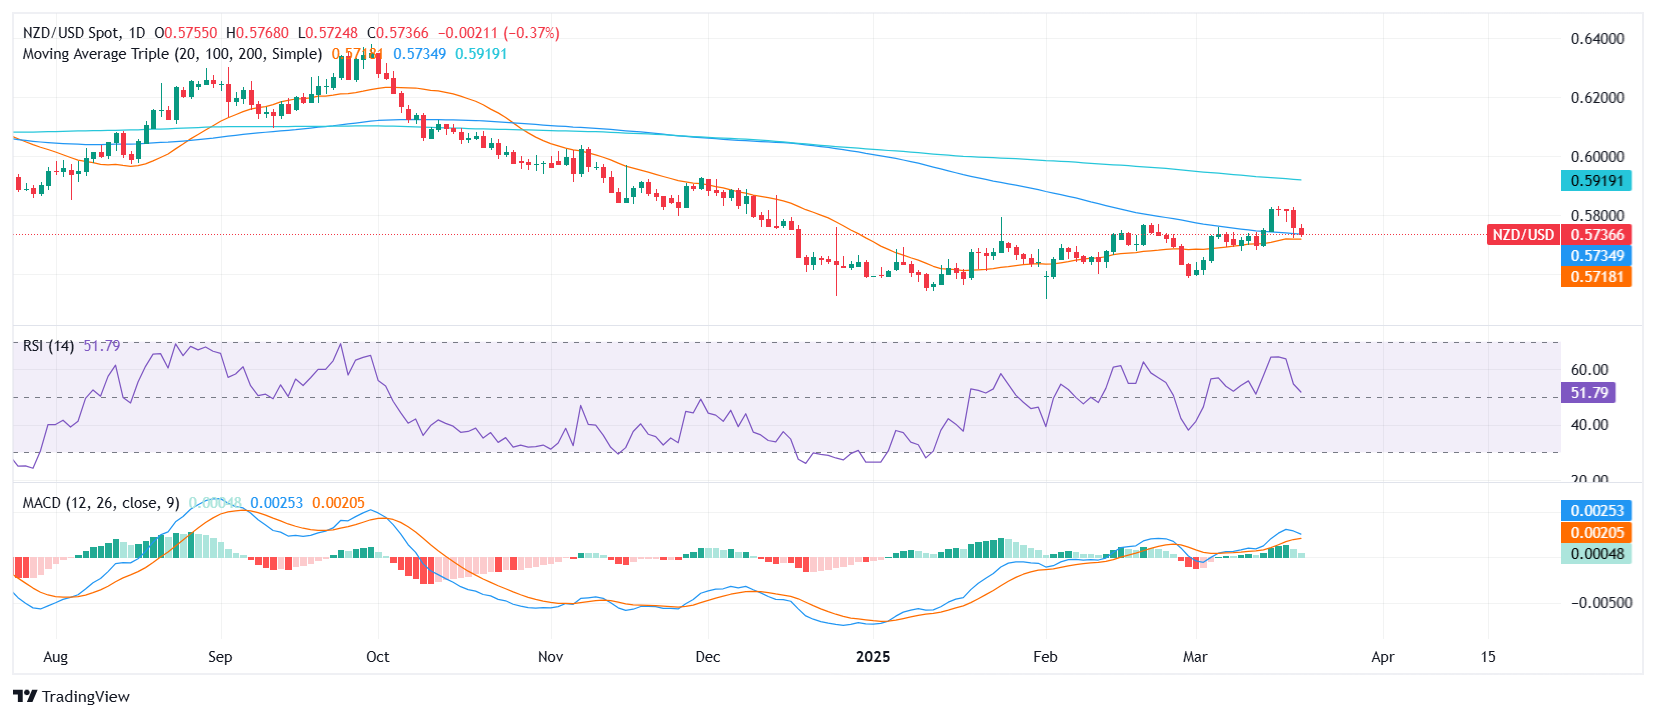
NZD/USD daily chart

Author

Patricio Martín

Patricio is an economist from Argentina passionate about global finance and understanding the daily movements of the markets.

More from Patricio Martín
Share:

Editor's Picks

EUR/USD recovers further from one-month low set on Friday, eyes mid-1.1800s on weaker USD

The EUR/USD pair is seen building on Friday's late recovery from the 1.1750-1.1740 region, or a nearly one-month trough, and gaining some follow-through positive traction at the start of a new week. The momentum lifts spot prices to the 1.1835 area during the Asian session and is sponsored by a broadly weaker US Dollar.

GBP/USD gathers strength above 1.3500 amid tariff confusion

The GBP/USD pair gains traction to around 1.3520 during the early Asian session on Monday. The US Dollar faces some selling pressure against the Cable as tariff uncertainty lingers. Traders will take more cues from the US Producer Price Index report for January, which will be published later on Friday. 

Gold rallies above $5,150 as Trump’s tariffs boost haven demand

Gold price extends the rally above $5,150 in the Asian session on Monday. The precious metal extends the rally amid US President Donald Trump’s tariff threats and uncertainty, which boost safe-haven flows. US-Iran geopolitical risks also linger, supporting the Gold price upside. 

Week ahead: Markets brace for heightened volatility as event risk dominates

Dollar strength dominates markets as risk appetite remains subdued. A Supreme Court ruling, geopolitics and Fed developments are in focus. Pivotal Nvidia earnings on Wednesday as investors question tech sector weakness. Yen and aussie diverge; both pound and euro could recoup their losses.

Liberation day take two, the tariff machine just changed gears

Let me caveat this from the outset. What we are watching is first-order mechanics, not the grand macro endgame. This is the market’s immediate reflex to a 15% Trump tariff levy dressed up as judicial drama. The Supreme Court blocked Trump tarrif hammer. The White House came back with a scalpel.

Ripple bulls defend key support amid waning retail demand and ETF inflows

XRP ticks up above $1.40 support, but waning retail demand suggests caution. XRP attracts $4 million in spot ETF inflows on Thursday, signaling renewed institutional investor interest.