|

NZD/USD Price Analysis: Kiwi bulls find some light, bears command the broader stage

  • The daily RSI recovered from near-oversold levels.
  • The hourly chart indicators exhibited a sharp uptick with the RSI above 70.
  • Buyers need to breach the key 20-day SMA for further ascents.

The NZD/USD was trading around the 0.6000 zone during Wednesday's session, reflecting an increase of 0.55%. The technical outlook indicates that sellers have had a more significant influence on the market. Nevertheless, buying momentum grew during the session as the Greenback was one of the weakest performers due to fundamental reasons.

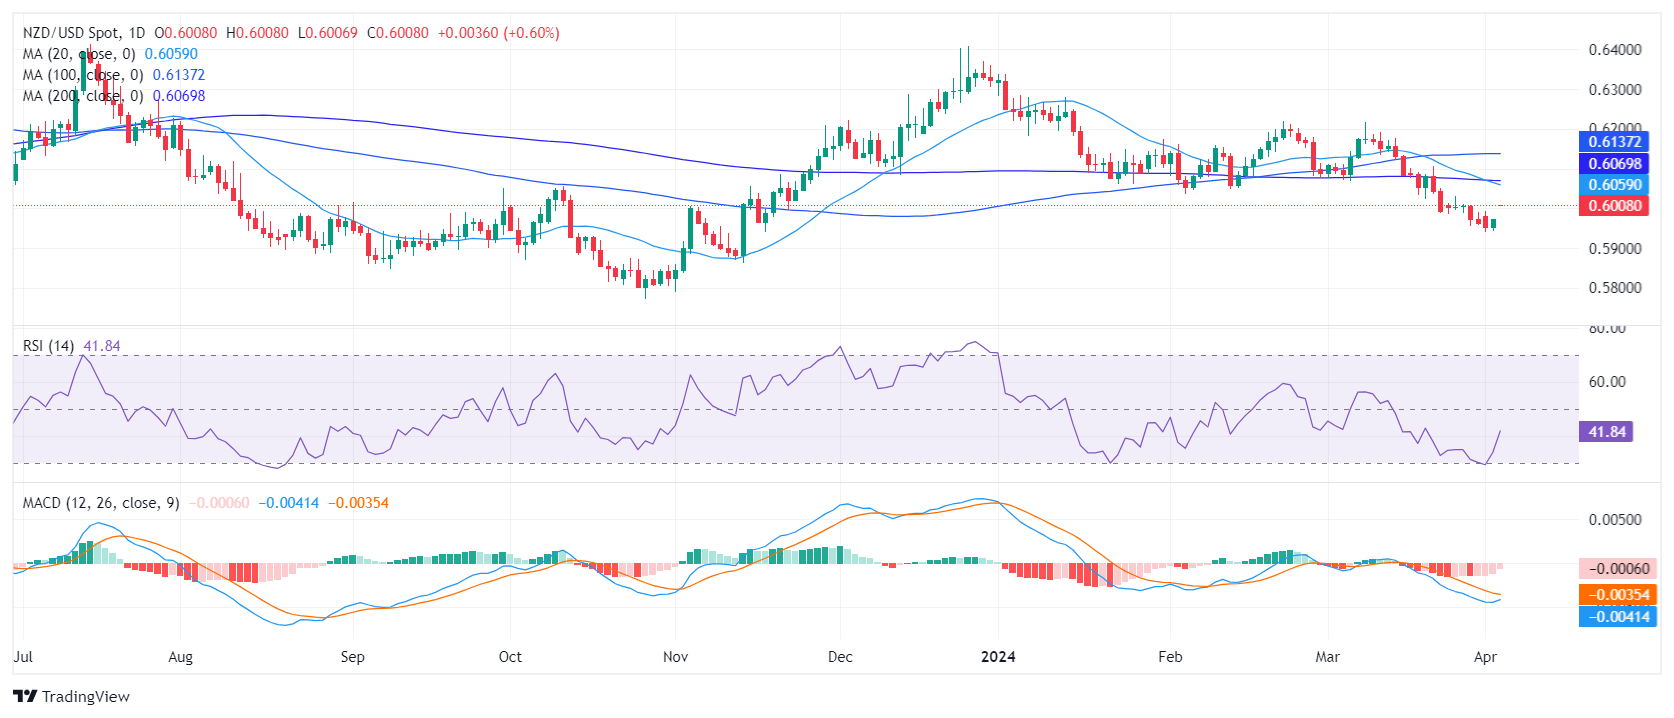
On the daily chart, the Relative Strength Index (RSI) predominantly exists in negative territory, despite Wednesday’s recovery from oversold areas, and currently stands at 44. This indicates that stronger market influence is currently in the hands of sellers despite the slight recovery.

NZD/USD daily chart
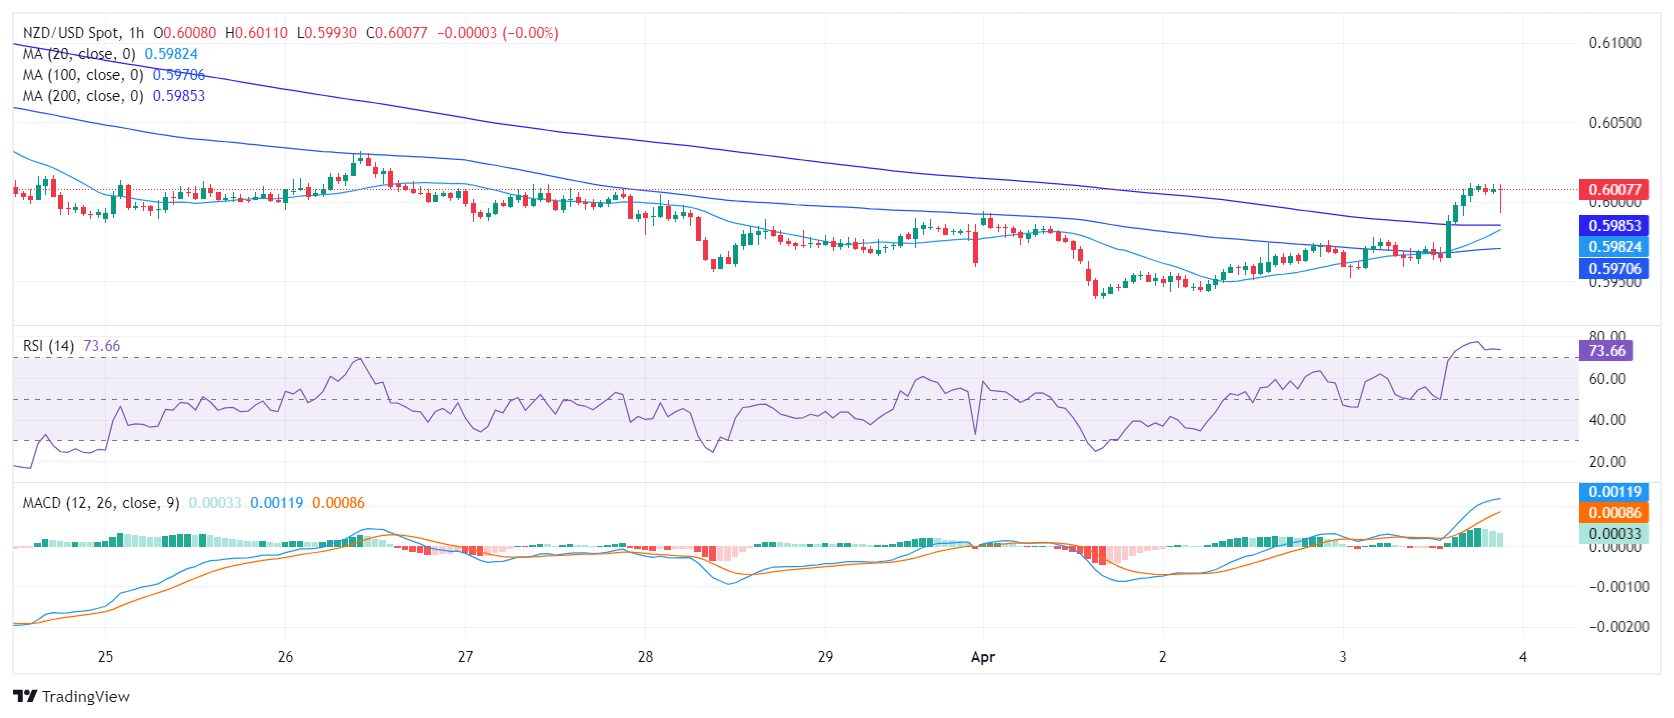
Turning to the hourly chart, an upward trend in the RSI was observed, reaching a peak at 76 before falling slightly to 71 as investors took some profits. At the same time, the Moving Average Convergence Divergence (MACD) histogram exhibited flat green bars, hinting at a waning short-term momentum. Despite an active sellers' market on the daily chart, the hourly indicators suggest a more balanced market with potential opportunities for buyers.

NZD/USD hourly chart
Broadly speaking, the NZD/USD is currently performing under a bearish signal across all Simple Moving Averages (SMA) as it trades below its 20,100-day, and 200-day  averages. The completed SMA crossover between the 20 and 200-day averages adds arguments for a negative outlook and could limit the pair's upside.

NZD/USD

Overview
Today last price0.6009
Today Daily Change0.0037
Today Daily Change %0.62
Today daily open0.5972
 
Trends
Daily SMA200.6065
Daily SMA500.6098
Daily SMA1000.6137
Daily SMA2000.607
 
Levels
Previous Daily High0.5974
Previous Daily Low0.5943
Previous Weekly High0.6032
Previous Weekly Low0.5956
Previous Monthly High0.6218
Previous Monthly Low0.5956
Daily Fibonacci 38.2%0.5962
Daily Fibonacci 61.8%0.5955
Daily Pivot Point S10.5952
Daily Pivot Point S20.5932
Daily Pivot Point S30.5921
Daily Pivot Point R10.5983
Daily Pivot Point R20.5994
Daily Pivot Point R30.6014

Author

Patricio Martín

Patricio is an economist from Argentina passionate about global finance and understanding the daily movements of the markets.


More from Patricio Martín
Share:

Editor's Picks

AUD/USD: The 0.7000 level holds the downside…for now

AUD/USD has clinched its fourth consecutive daily pullback on Thursday, coming closer to the key 0.7000 region while breaking below the critical 200-day SMA at the same time. The Aussie’s decline comes on the back of further gains in the Greenback in a context of rising yields and Fed rate hike bets.

USD/JPY keeps the red near 158.00 as Japanese Yen firms up

USD/JPY retreats from three-week highs and holds losses near 158.00 in the Asian session on Thursday. Surging Japanese bond yields lift the Yen amid looming intervention risks, while the US Dollar preserves overnight gains to a two-month high amid hawkish Fed bets and elevated US bond yields.

Gold bounces off lows, still below $4,300

Gold builds on Wednesday’s retracement, briefly slipping back below $4,250 per troy ounce to attempt a lacklustre rebound afterwards. The better tone in the US Dollar, rising US Treasury yields and expectation of extra rate hikes by the Fed continue to weigh on the precious metal in the latter part of Thursday’s NA session.

XRP is flashing three bullish signals heading into a historically weak October
XRP (XRP) is still flashing 3 bullish signals across its holders, derivatives, and ETF data. These signals come as the token gave back part of its September gains on Thursday. The token traded near $1.50 at press time, down about 6.3% over 24 hours, according to BeInCrypto Markets data. The pullback still leaves XRP up over 15.6% on the week, a gain that tracks a broader market rally.
Advanced economies: From one example of resilience to another
History tends to repeat itself in advanced economies. Once again, growth ultimately fell short of expectations by only a small margin in the first half of 2026, despite the conflict in Iran. As early as 2025, the impact of tariffs was less severe than feared.
BoJ Recap: Not as hawkish as expected

The Bank of Japan (BoJ) raised its short-term interest-rate target to 1.25% from 1.00% in a 7-2 vote, marking another step in the normalisation of monetary policy and widely matching what everyone has been expecting for weeks.